
Soubor:Clune2016 food lca.svg

Velikost tohoto PNG náhledu tohoto SVG souboru: 750 × 600 pixelů. Jiná rozlišení: 300 × 240 pixelů | 600 × 480 pixelů | 960 × 768 pixelů | 1 280 × 1 024 pixelů | 2 560 × 2 048 pixelů | 1 000 × 800 pixelů.
Původní soubor (soubor SVG, nominální rozměr: 1 000 × 800 pixelů, velikost souboru: 49 KB)
| Tento soubor pochází z Wikimedia Commons. Níže jsou zobrazeny informace, které obsahuje jeho tamější stránka s popisem souboru. |
Popis
| Popis |
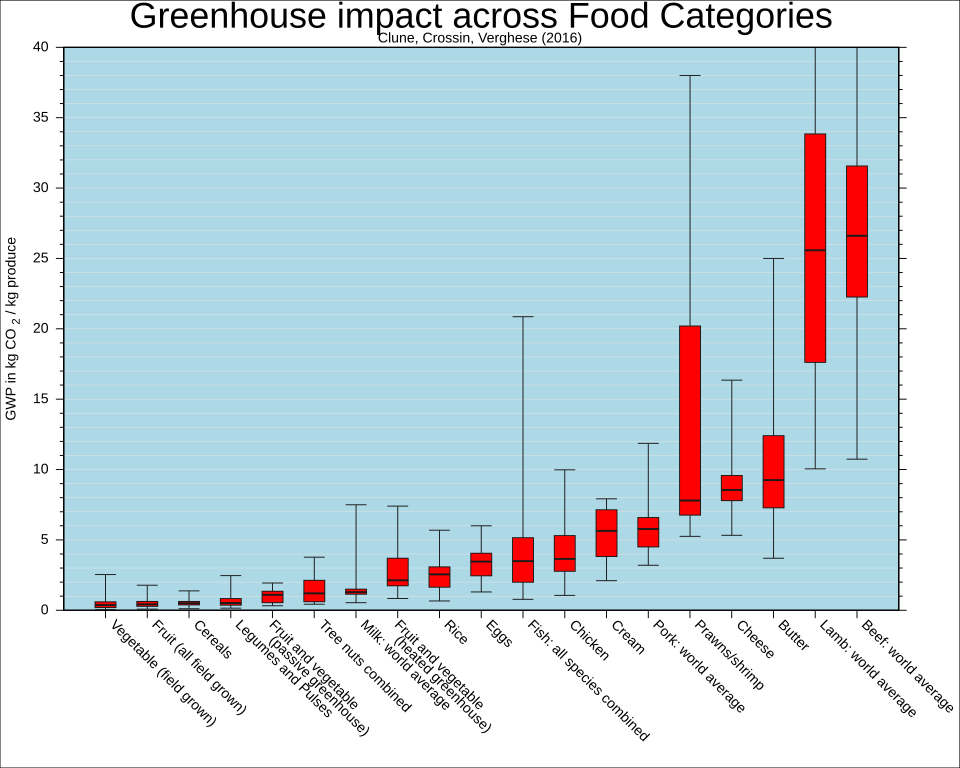
English: Global Warming Potential of Food Categories. Values are from a systematic review of Life Cycle Assessment studies of various food products. Boxes represent: Q1-Q3 of the values, candlesticks: Min-Max,vertical line: median.
The data is from table 4 of Stephen Clune, Enda Crossin, Karli Verghese: Systematic review of greenhouse gas emissions for different fresh food categories. In: Journal of Cleaner Production. 2016. DOI: 10.1016/j.jclepro.2016.04.082
Deutsch: Treibhauspotential von Lebensmittelgruppen. Die Werte stammen aus einer systamtischen Übersicht einer Vielzahl von Lebenszyklusanalysen. Balken stellen Q1-Q3 der gefundenen Werte dar, Stifte Min-Max, die vertikale Linie den Median.
Daten aus Tabelle 4 in: Stephen Clune, Enda Crossin, Karli Verghese: Systematic review of greenhouse gas emissions for different fresh food categories. In: Journal of Cleaner Production. 2016. DOI: 10.1016/j.jclepro.2016.04.082 |
| Datum | |
| Zdroj | Vlastní dílo |
| Autor | DeWikiMan |
| Další verze | File:Clune2016 food lca-de.svg (German language version) |
Then the plot has been created by copying the data of Clune et. al (2016), Table 4, into a colon separated text file and adding the row number as the first column
#nr;name;mean;median;stddev;deviation from mean;min;max;Q1;Q3;No of LCA studies;No. of GWP values
1;Vegetable (field grown);0.37;0.47;0.39;83%;0.04;2.54;0.19;0.60;33;140
2;Fruit (all field grown);0.42;0.50;0.32;64%;0.08;1.78;0.28;0.63;77;250
3;Cereals;0.50;0.53;0.22;42%;0.11;1.38;0.38;0.63;31;90
4;Legumes and Pulses;0.51;0.66;0.45;67%;0.15;2.46;0.36;0.83;16;51
5;Fruit and vegetable\n(passive greenhouse);1.10;1.02;0.49;48%;0.32;1.94;0.54;1.35;5;15
6;Tree nuts combined;1.20;1.42;0.93;66%;0.43;3.77;0.61;2.13;7;21
7;Milk: world average;1.29;1.39;0.58;41%;0.54;7.50;1.14;1.50;77;262
8;Fruit and vegetable\n(heated greenhouse);2.13;2.81;1.61;57%;0.84;7.4;1.74;3.7;18;53
9;Rice;2.55;2.66;1.29;48%;0.66;5.69;1.64;3.08;12;27
10;Eggs;3.46;3.39;1.21;36%;1.30;6.00;2.45;4.05;19;38
11;Fish: all species combined;3.49;4.41;3.62;82%;0.78;20.86;1.99;5.16;47;148
12;Chicken;3.65;4.12;1.72;42%;1.06;9.98;2.77;5.31;29;95
13;Cream;5.64;5.32;1.62;31%;2.10;7.92;3.82;7.14;3;4
14;Pork: world average;5.77;5.85;1.63;28%;3.20;11.86;4.50;6.59;38;130
15;Prawns/shrimp;7.80;14.85;12.37;83%;5.25;38.00;6.76;20.20;7;11
16;Cheese;8.55;8.86;2.07;23%;5.33;16.35;7.79;9.58;22;38
17;Butter;9.25;11.52;7.37;64%;3.70;25.00;7.28;12.41;4;8
18;Lamb: world average;25.58;27.91;11.93;43%;10.05;56.70;17.61;33.85;22;56
19;Beef: world average;26.61;28.73;12.47;43%;10.74;109.5;22.26;31.57;49;165
and then running the following script with Gnuplot 4.4:
set terminal svg enhanced size 1000 800 fname "Liberation Sans" fsize 11
set output "Clune2016_food_lca.svg"
set title "Greenhouse impact across Food Categories"  font "Liberation Sans, 28"
set datafile missing '"#N/A"'
set datafile separator ";"
set nokey
set label 'Clune, Crossin, Verghese (2016)' at screen 0.5,0.95 center
set obj 1 rectangle behind from screen 0,0 to screen 1,1
set obj 1 fillstyle solid 1.0 fillcolor rgbcolor "white"
set obj 2 rectangle behind from graph 0,0 to graph 1,1
set obj 2 fillstyle solid 1.0 fillcolor rgbcolor "light-blue"

set grid noxtics ytics mytics lt 0 lw 0.5 lc rgb "grey90"
set yrange [0:40]
set xrange [0:20]
set xtics out nomirror rotate by -45
set ytics out mirror 0,5,40
set mytics 5
set ylabel 'GWP in kg CO_2 / kg produce'
set boxwidth 0.5
set style fill solid 1.0 border rgb 'grey10'

plot "clune2016_foodlca_table4.txt" using 1:9:8:7:10:xticlabels(2)  linecolor rgb "red30" with candlesticks whiskerbars, \
     "clune2016_foodlca_table4.txt" using 1:3:3:3:3 with candlesticks lt -1 lw 2 notitle
Licence
Já, držitel autorských práv k tomuto dílu, ho tímto zveřejňuji za podmínek následujících licencí:

|
Tento dokument smí být kopírován, šířen nebo upravován podle podmínek Svobodné licence GNU pro dokumenty verze 1.2 nebo libovolné vyšší verze publikované nadací Free Software Foundation. Dokument nemá neměnné části ani texty na předním či zadním přebalu. Kopie textu licence je k dispozici v oddíle nazvaném GNU Free Documentation License. |
This file is licensed under the Creative Commons Attribution-Share Alike 4.0 International, 3.0 Unported, 2.5 Generic, 2.0 Generic and 1.0 Generic license.
- Dílo smíte:
- šířit – kopírovat, distribuovat a sdělovat veřejnosti
- upravovat – pozměňovat, doplňovat, využívat celé nebo částečně v jiných dílech
- Za těchto podmínek:
- uveďte autora – Máte povinnost uvést autorství, poskytnout odkaz na licenci a uvést, pokud jste provedli změny. Toho můžete docílit jakýmkoli rozumným způsobem, avšak ne způsobem naznačujícím, že by poskytovatel licence schvaloval nebo podporoval vás nebo vaše užití díla.
- zachovejte licenci – Pokud tento materiál jakkoliv upravíte, přepracujete nebo použijete ve svém díle, musíte své příspěvky šířit pod stejnou nebo slučitelnou licencí jako originál.
Můžete si zvolit libovolnou z těchto licencí.
Historie souboru
Kliknutím na datum a čas se zobrazí tehdejší verze souboru.
| Datum a čas | Náhled | Rozměry | Uživatel | Komentář | |
|---|---|---|---|---|---|
| současná | 8. 10. 2016, 13:32 | | 1 000 × 800 (49 KB) | DeWikiMan | colors added; labels changed to improve readability |
| 8. 10. 2016, 01:19 |  | 1 000 × 800 (48 KB) | DeWikiMan | white background | |
| 8. 10. 2016, 00:45 |  | 1 000 × 800 (48 KB) | DeWikiMan | year fixed | |
| 8. 10. 2016, 00:22 |  | 1 000 × 800 (48 KB) | DeWikiMan | {{Information |Description ={{en|1=Global Warming Potential of Food Categories. Values are from a systematic review of Life Cycle Assessment studies of various food products. Boxes represent: Q1-Q3 of the values, candlesticks: Min-Max,vertical line:... |
Využití souboru
Tento soubor používají následující 3 stránky:
Globální využití souboru
Tento soubor využívají následující wiki:
- Využití na el.wikipedia.org
- Využití na en.wikipedia.org
- Využití na es.wikipedia.org
- Využití na ha.wikipedia.org
- Využití na ig.wiktionary.org