
Soubor:AntarcticBedrock.jpg

Velikost tohoto náhledu: 600 × 600 pixelů. Jiná rozlišení: 240 × 240 pixelů | 480 × 480 pixelů | 768 × 768 pixelů | 1 024 × 1 024 pixelů | 1 400 × 1 400 pixelů.
Původní soubor (1 400 × 1 400 pixelů, velikost souboru: 509 KB, MIME typ: image/jpeg)
| Tento soubor pochází z Wikimedia Commons. Níže jsou zobrazeny informace, které obsahuje jeho tamější stránka s popisem souboru. |
Popis
| Popis |
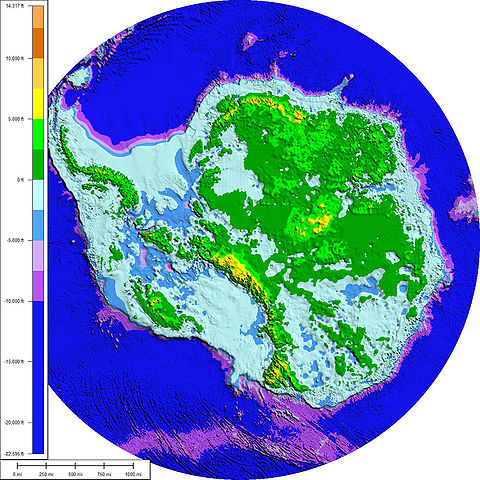
English: The above map shows the subglacial topography and bathymetry of Antarctica. As indicated by the scale on left-hand side, the different shades of blue and purple indicate parts of the ocean floor and sub-ice bedrock, which are below sea level. The other colours indicate Antarctic bedrock lying above sea level. Each colour represents an interval of 2,500 feet in elevation. Map is not corrected for sea level rise or isostatic rebound, which would occur if the Antarctic ice sheet completely melted to expose the bedrock surface. Français : La carte ci-dessus montre la topographie et la bathymétrie sous-glaciaires de l'Antarctique. Comme l'indique l'échelle de gauche, les différentes nuances de bleu et de violet indiquent les parties du fond océanique et du substrat rocheux sous-glaciaire qui sont situées sous le niveau de la mer. Les autres couleurs indiquent les parties du substrat rocheux situées au-dessus du niveau de la mer. Chaque couleur représente un intervalle d'environ 800 mètres (2 500 pieds) d'altitude. La carte n'est pas corrigée de l'élévation du niveau de la mer ou du rebond isostatique qui se produirait si la calotte glaciaire antarctique fondait entièrement, libérant la surface du substrat rocheux. Čeština: Výše uvedená mapa zobrazuje subglaciální topografii a batymetrii Antarktidy. Jak naznačuje měřítko na levé straně, různé odstíny modré a fialové barvy označují části oceánského dna a podledovcového podloží, které se nacházejí pod hladinou moře. Ostatní barvy označují antarktické podloží, které leží nad hladinou moře. Každá barva představuje interval o výšce 2 500 stop (762 m). Mapa není korigována o vzestup mořské hladiny nebo izostatický odraz, ke kterému by došlo, kdyby antarktický ledový příkrov zcela roztál a obnažil povrch skalního podloží. |
| Datum | |
| Zdroj | This map was prepared from BEDMAP gridded data-set for bed-elevation south of 60 degrees S using Global Mapper 7.0.1. The faint rectilinear pattern seen in the shaded relief is an artifact of the gridding of data from linear seismic surveys. The data used to make this map came from "A new ice thickness and subglacial topographic model of the Antarctic" prepared by the BEDMAP Consortium, which is sponsored by the European Ice Sheet Modelling Initiative, Scientific Committee on Antarctic Research. |
| Autor | Paul V. heinrich |
Licence
Já, držitel autorských práv k tomuto dílu, ho tímto zveřejňuji za podmínek následující licence:
Tento soubor podléhá licenci Creative Commons Uveďte autora 3.0 Unported
- Dílo smíte:
- šířit – kopírovat, distribuovat a sdělovat veřejnosti
- upravovat – pozměňovat, doplňovat, využívat celé nebo částečně v jiných dílech
- Za těchto podmínek:
- uveďte autora – Máte povinnost uvést autorství, poskytnout odkaz na licenci a uvést, pokud jste provedli změny. Toho můžete docílit jakýmkoli rozumným způsobem, avšak ne způsobem naznačujícím, že by poskytovatel licence schvaloval nebo podporoval vás nebo vaše užití díla.
Historie souboru
Kliknutím na datum a čas se zobrazí tehdejší verze souboru.
| Datum a čas | Náhled | Rozměry | Uživatel | Komentář | |
|---|---|---|---|---|---|
| současná | 28. 8. 2008, 06:03 | | 1 400 × 1 400 (509 KB) | Cristellaria | == Summary == {{Information |Description=The above map shows the subglacial topography and bathymetry of Antarctica. As indicated by the scale on left-hand side, the different shades of blue and purple indicate parts of the ocean floor and sub-ice bedrock |
| 28. 8. 2008, 05:58 |  | 1 400 × 1 400 (509 KB) | Cristellaria | {{Information |Description= |Source= |Date= |Author= |Permission= |other_versions= }} | |
| 13. 3. 2008, 22:16 |  | 1 400 × 1 400 (515 KB) | Cristellaria | {{Information |Description=The above map shows the subglacial topography and bathymetry of Antarctica. As indicated by the scale on left-hand side, the different shades of blue and purple indicate parts of the ocean floor and sub-ice bedrock, which are be |
Využití souboru
Tento soubor používají následující 3 stránky:
Globální využití souboru
Tento soubor využívají následující wiki:
- Využití na ar.wikipedia.org
- Využití na ast.wikipedia.org
- Využití na bn.wikipedia.org
- Využití na bxr.wikipedia.org
- Využití na ca.wikipedia.org
- Využití na de.wikipedia.org
- Využití na el.wikipedia.org
- Využití na en.wikipedia.org
- West Antarctic Ice Sheet
- Portal:Maps/Maps/Geographic
- Tipping points in the climate system
- Portal:Maps/Maps/Geographic/11
- Wikipedia:ITN archives/2009/February
- Wikipedia:Graphics Lab/Map workshop/Archive/Apr 2014
- Wikipedia:Reference desk/Archives/Science/2016 July 19
- User:JPxG/Coolpix
- User:JPxG/!
- User:HN016AQ/sandbox
- Využití na es.wikipedia.org
- Využití na et.wikipedia.org
- Využití na fr.wikipedia.org
- Využití na fr.wikinews.org
- Využití na gl.wikipedia.org
- Využití na id.wikipedia.org
- Využití na it.wikipedia.org
- Využití na ja.wikipedia.org
- Využití na ka.wikipedia.org
- Využití na kn.wikipedia.org
- Využití na la.wikipedia.org
- Využití na mk.wikipedia.org
- Využití na mn.wikipedia.org
- Využití na nl.wikipedia.org
- Využití na nn.wikipedia.org
- Využití na pl.wikipedia.org
- Využití na pnb.wikipedia.org
- Využití na pt.wikipedia.org
- Využití na sl.wikipedia.org
- Využití na sr.wikipedia.org
- Využití na tr.wikipedia.org
Zobrazit další globální využití tohoto souboru.