
Soubor:South Africa 2011 dominant language map.svg

Velikost tohoto PNG náhledu tohoto SVG souboru: 684 × 599 pixelů. Jiná rozlišení: 274 × 240 pixelů | 548 × 480 pixelů | 876 × 768 pixelů | 1 168 × 1 024 pixelů | 2 337 × 2 048 pixelů | 809 × 709 pixelů.
Původní soubor (soubor SVG, nominální rozměr: 809 × 709 pixelů, velikost souboru: 798 KB)
| Tento soubor pochází z Wikimedia Commons. Níže jsou zobrazeny informace, které obsahuje jeho tamější stránka s popisem souboru. |
Popis
| Popis |
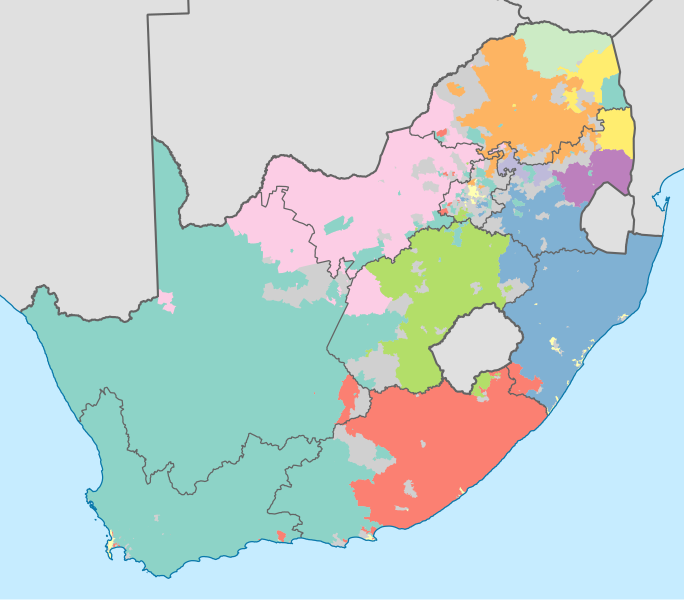
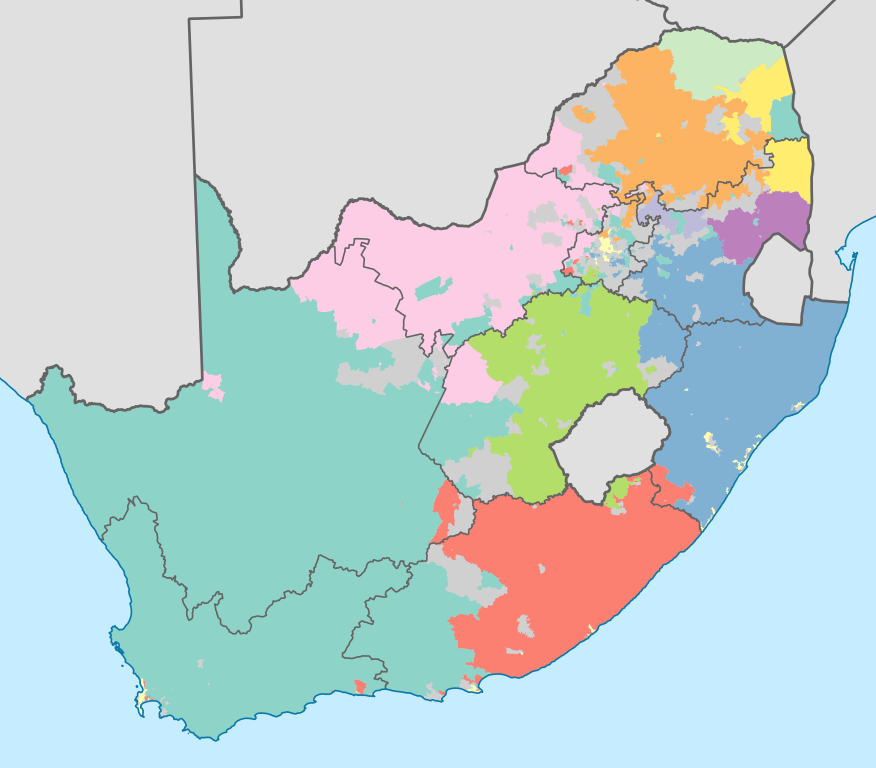
English: Map showing the dominant home languages in South Africa, based on ward-level data from the 2011 census. In this context, a language is dominant if it more than 50% of the population in a ward speak it at home, or more than 33% speak it and no other language is spoken by more than 25%.
English
Afrikaans
isiNdebele
isiXhosa
isiZulu
Sesotho sa Leboa
Sesotho
Setswana
siSwati
Tshivenda
Xitsonga
No language dominant
Projection is Albers Equal-Area Conic, with standard parallels at 25.5° S and 31.5° S, and origin at 28.5° S 24.5° E. |
| Datum | |
| Zdroj | Statistics South Africa's Census 2011 is the source of the basic population data. The map results from my own processing of the data. For ward boundaries see File:South Africa electoral wards 2011 blank.svg. |
| Autor | Htonl |
| Další verze |
South Africa 2011 dominant language map (hex cells).svg: .svg) |
Licence
The following license applies to the population data on which the map is based:

|
Držitel autorských práv k tomuto souboru, Stats SA, dovoluje jeho užití komukoli pro jakýkoli účel, za podmínky, že je držitel práv správně uveden. Další šíření, tvorba odvozených děl, komerční využití i všechna další užití jsou dovolena. |
Uveďte autora:
"the user acknowledges Stats SA as the source of the basic data wherever they process, apply, utilise, publish or distribute the data, and also that they specify that the relevant application and analysis (where applicable) result from their own processing of the data" [1]
|
The following tag applies to the map itself:
| Já, autor tohoto díla, jej tímto uvolňuji jako volné dílo, a to celosvětově. V některých zemích to není podle zákona možné; v takovém případě: Poskytuji komukoli právo užívat toto dílo za libovolným účelem, a to bezpodmínečně s výjimkou podmínek vyžadovaných zákonem. |
Historie souboru
Kliknutím na datum a čas se zobrazí tehdejší verze souboru.
| Datum a čas | Náhled | Rozměry | Uživatel | Komentář | |
|---|---|---|---|---|---|
| současná | 18. 11. 2012, 23:09 | | 809 × 709 (798 KB) | Htonl | =={{int:filedesc}}== {{Information |Description={{en|1=Map showing the dominant home languages in South Africa, based on ward-level data from the 2011 census. In this context, a language is dominant if it more than 50% of the population in a ward speak... |
Využití souboru
Tento soubor používá následující stránka:
Globální využití souboru
Tento soubor využívají následující wiki:
- Využití na af.wikipedia.org
- Využití na de.wikipedia.org
- Využití na dsb.wikipedia.org
- Využití na en.wikipedia.org
- Využití na eo.wikipedia.org
- Využití na frr.wikipedia.org
- Využití na fr.wikipedia.org
- Využití na fr.wiktionary.org
- Využití na he.wikipedia.org
- Využití na it.wikipedia.org
- Využití na ka.wikipedia.org
- Využití na ko.wikipedia.org
- Využití na lb.wikipedia.org
- Využití na ml.wikipedia.org
- Využití na mzn.wikipedia.org
- Využití na no.wikipedia.org
- Využití na pt.wikipedia.org
- Využití na rm.wikipedia.org
- Využití na ro.wikipedia.org
- Využití na ru.wikipedia.org
- Využití na sh.wikipedia.org
- Využití na simple.wikipedia.org
- Využití na sr.wikipedia.org
- Využití na ss.wikipedia.org
- Využití na sv.wikipedia.org
- Využití na sw.wikipedia.org
- Využití na szl.wikipedia.org
- Využití na te.wikipedia.org
- Využití na tg.wikipedia.org
- Využití na tr.wikipedia.org
- Využití na uk.wikipedia.org
- Využití na xh.wikipedia.org
- Využití na zh.wikipedia.org
- Využití na zu.wikipedia.org