
Soubor:20210331 Global tree cover loss - World Resources Institute.svg

Velikost tohoto PNG náhledu tohoto SVG souboru: 800 × 507 pixelů. Jiná rozlišení: 320 × 203 pixelů | 640 × 405 pixelů | 1 024 × 649 pixelů | 1 280 × 811 pixelů | 2 560 × 1 622 pixelů | 1 184 × 750 pixelů.
Původní soubor (soubor SVG, nominální rozměr: 1 184 × 750 pixelů, velikost souboru: 7 KB)
| Tento soubor pochází z Wikimedia Commons. Níže jsou zobrazeny informace, které obsahuje jeho tamější stránka s popisem souboru. |
Popis
| Popis |
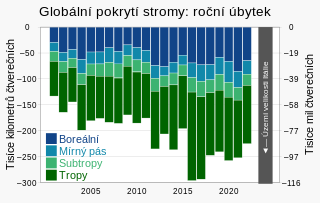
English: Stacked column chart showing annual loss of tree cover, globally, based on World Resources Institute data published on Mongabay.
|
| Datum | |
| Zdroj | Vlastní dílo |
| Autor | RCraig09 |
| Další verze |
|

SVG code generation
- SVG code for Version 1 was automatically generated using the column graph Excel spreadsheet linked at User:RCraig09/Excel to XML for SVG.
- Version 3 involved changes direct to the XML code that were beyond the range of the spreadsheet.
- Version 7 was mainly generated from the spreadsheet, with some text and other changes made manually in a text editor.
Licence
Já, držitel autorských práv k tomuto dílu, ho tímto zveřejňuji za podmínek následující licence:
Tento soubor podléhá licenci Creative Commons Uveďte autora-Zachovejte licenci 4.0 International
- Dílo smíte:
- šířit – kopírovat, distribuovat a sdělovat veřejnosti
- upravovat – pozměňovat, doplňovat, využívat celé nebo částečně v jiných dílech
- Za těchto podmínek:
- uveďte autora – Máte povinnost uvést autorství, poskytnout odkaz na licenci a uvést, pokud jste provedli změny. Toho můžete docílit jakýmkoli rozumným způsobem, avšak ne způsobem naznačujícím, že by poskytovatel licence schvaloval nebo podporoval vás nebo vaše užití díla.
- zachovejte licenci – Pokud tento materiál jakkoliv upravíte, přepracujete nebo použijete ve svém díle, musíte své příspěvky šířit pod stejnou nebo slučitelnou licencí jako originál.
Historie souboru
Kliknutím na datum a čas se zobrazí tehdejší verze souboru.
| Datum a čas | Náhled | Rozměry | Uživatel | Komentář | |
|---|---|---|---|---|---|
| současná | 2. 8. 2023, 13:48 | | 1 184 × 750 (7 KB) | RCraig09 | Version 10: extend gridlines to right |
| 2. 8. 2023, 07:12 |  | 1 184 × 750 (7 KB) | RCraig09 | Version 9: update to include 2022 data | |
| 1. 8. 2023, 11:34 |  | 1 150 × 750 (9 KB) | Jirka Dl | File uploaded using svgtranslate tool (https://svgtranslate.toolforge.org/). Added translation for cs. | |
| 17. 9. 2022, 23:19 |  | 1 150 × 750 (6 KB) | RCraig09 | Version 7: update with data through 2021 | |
| 24. 4. 2021, 19:09 |  | 1 130 × 750 (5 KB) | RCraig09 | Version 6: More precise representation of area of Italy, in the gray column's height. | |
| 24. 4. 2021, 00:11 |  | 1 130 × 750 (5 KB) | RCraig09 | Version 5: Change left vertical axis label to Thousand Square Kilometers, per talk page. Minor svg optimization. | |
| 23. 4. 2021, 06:35 |  | 1 130 × 750 (6 KB) | RCraig09 | Version 4: tone down the "Italy" column color, and make "Italy" text easier to read | |
| 23. 4. 2021, 05:49 |  | 1 130 × 750 (6 KB) | RCraig09 | Version 3: Responding to suggestions by User;Efbrazil on Talk page, adding context and meaning (right Y axis 'thousand square miles' labels, and illustration of area of Italy), darkening color of columns. Also shortened xml a bit | |
| 4. 4. 2021, 21:47 |  | 1 000 × 750 (6 KB) | RCraig09 | Version 2: inverted polarity of y values so tree cover loss is represented as downward-projecting columns | |
| 1. 4. 2021, 04:40 |  | 1 000 × 750 (6 KB) | RCraig09 | Uploaded own work with UploadWizard |
Využití souboru
Tento soubor používají následující 2 stránky:
Globální využití souboru
Tento soubor využívají následující wiki:
- Využití na bn.wikipedia.org
- Využití na en.wikipedia.org
- Causes of climate change
- Deforestation
- Bar chart
- Environmental degradation
- Land degradation
- Habitat destruction
- Human impact on the environment
- Effects of climate change
- Climate change
- Deforestation by continent
- Deforestation and climate change
- Portal:Climate change
- User talk:InformationToKnowledge/sandbox
- Využití na es.wikipedia.org
- Využití na eu.wikipedia.org
- Využití na fa.wikipedia.org
- Využití na fr.wikipedia.org
- Využití na ig.wikipedia.org
- Využití na it.wikipedia.org
- Využití na ko.wikipedia.org
- Využití na mk.wikipedia.org
- Využití na ms.wikipedia.org
- Využití na nl.wikipedia.org
- Využití na pt.wikipedia.org
- Využití na rw.wikipedia.org
- Využití na tr.wikipedia.org
- Využití na uk.wikipedia.org
- Využití na uz.wikipedia.org
- Využití na zh.wikipedia.org