
Soubor:US timeline. Number of overdose deaths from all drugs.jpg
Velikost tohoto náhledu: 800 × 600 pixelů. Jiná rozlišení: 320 × 240 pixelů | 640 × 480 pixelů | 1 024 × 768 pixelů | 1 200 × 900 pixelů.
Původní soubor (1 200 × 900 pixelů, velikost souboru: 180 KB, MIME typ: image/jpeg)
| Tento soubor pochází z Wikimedia Commons. Níže jsou zobrazeny informace, které obsahuje jeho tamější stránka s popisem souboru. |

|
K tomuto obrázku existuje vektorová verze (v SVG). Pokud je lepší, používejte raději tu.
File:US timeline. Number of overdose deaths from all drugs.jpg → File:US timeline. Number of overdose deaths from all drugs.svg
Podrobnější informace o vektorové grafice najdete na stránce Commons:Transition to SVG. Také si můžete přečíst informace o podpoře formátu SVG v MediaWiki. |
 |
Popis
| Popis |
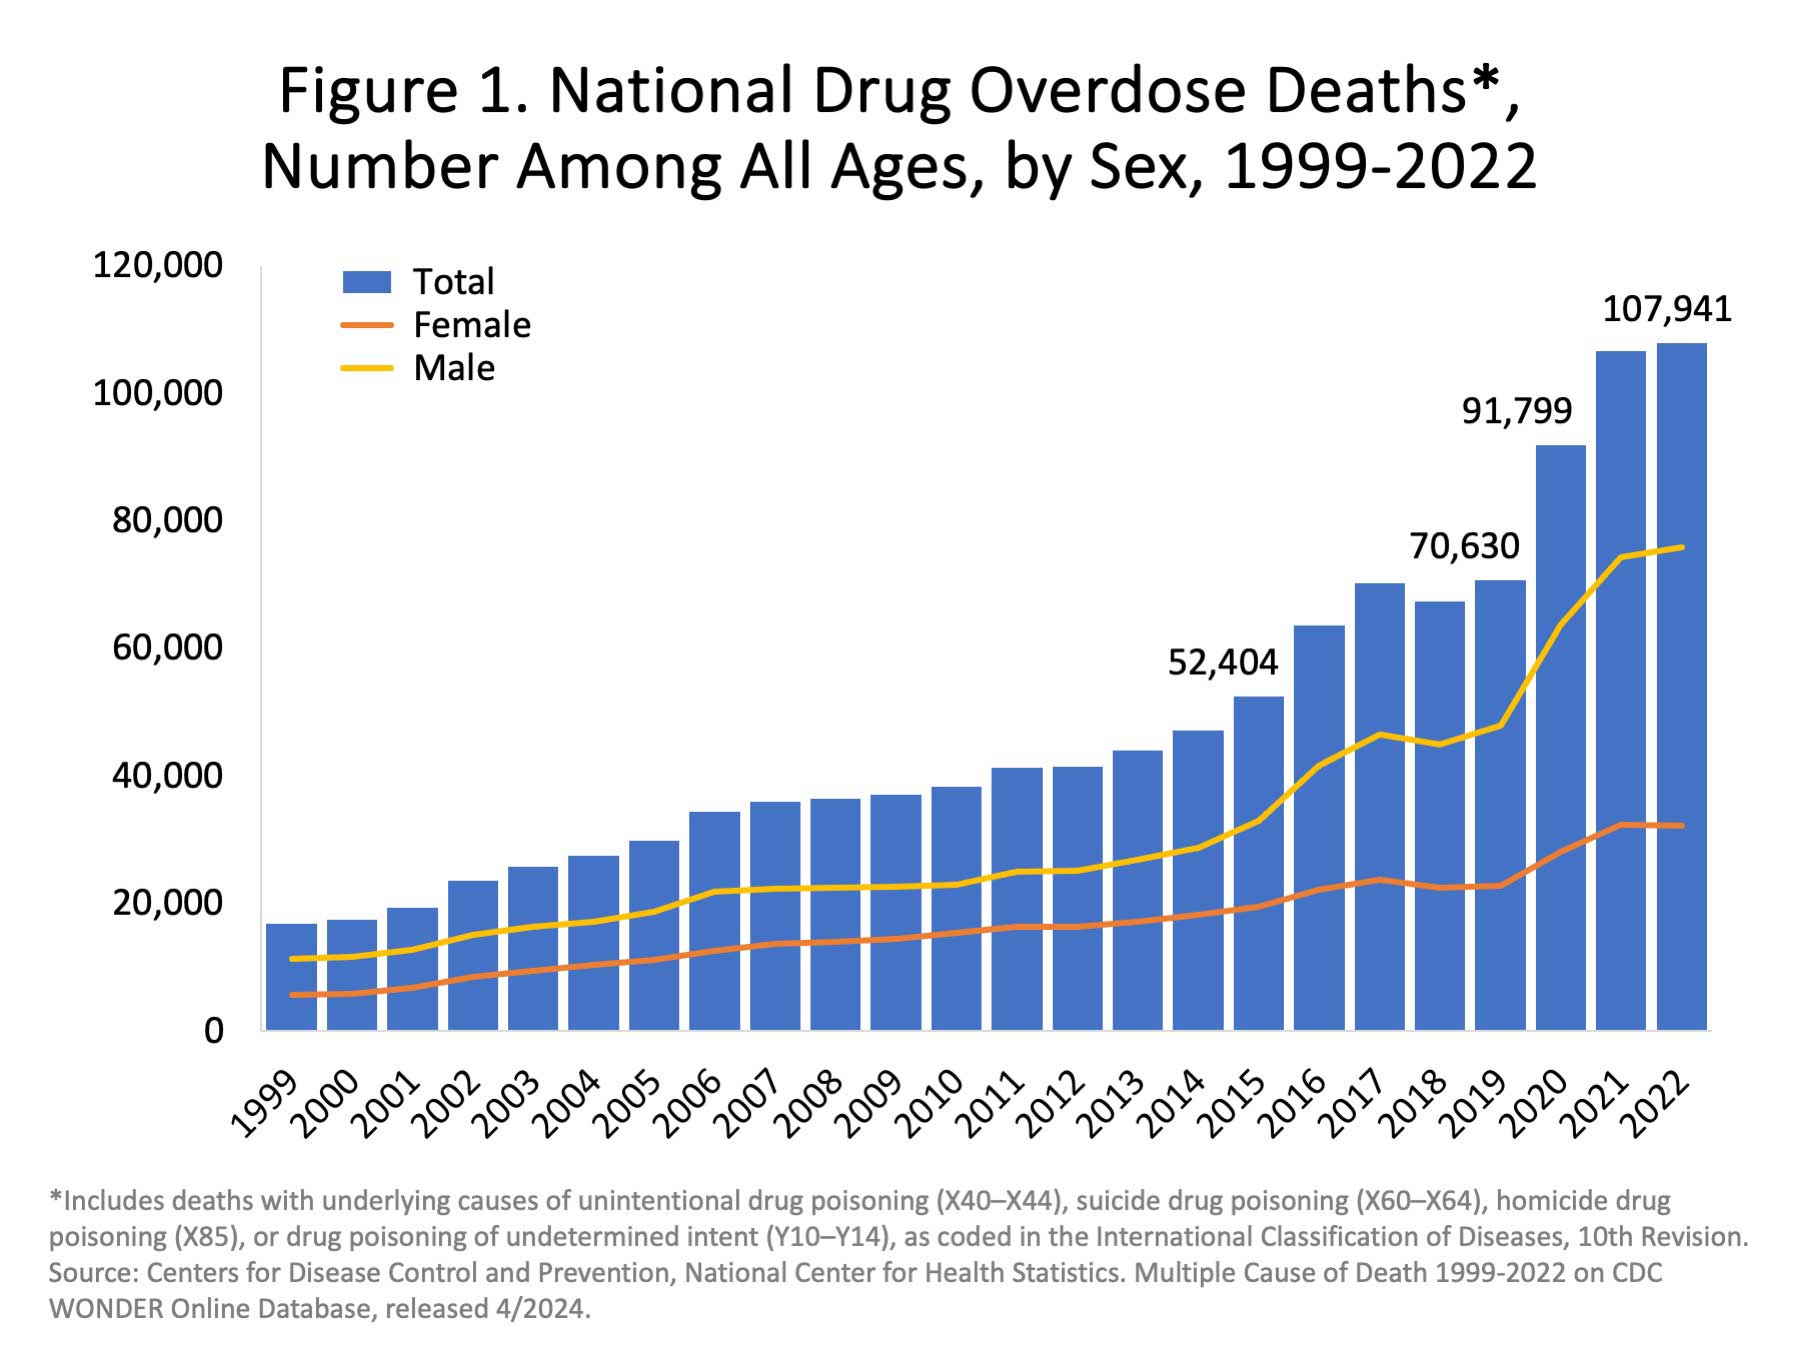
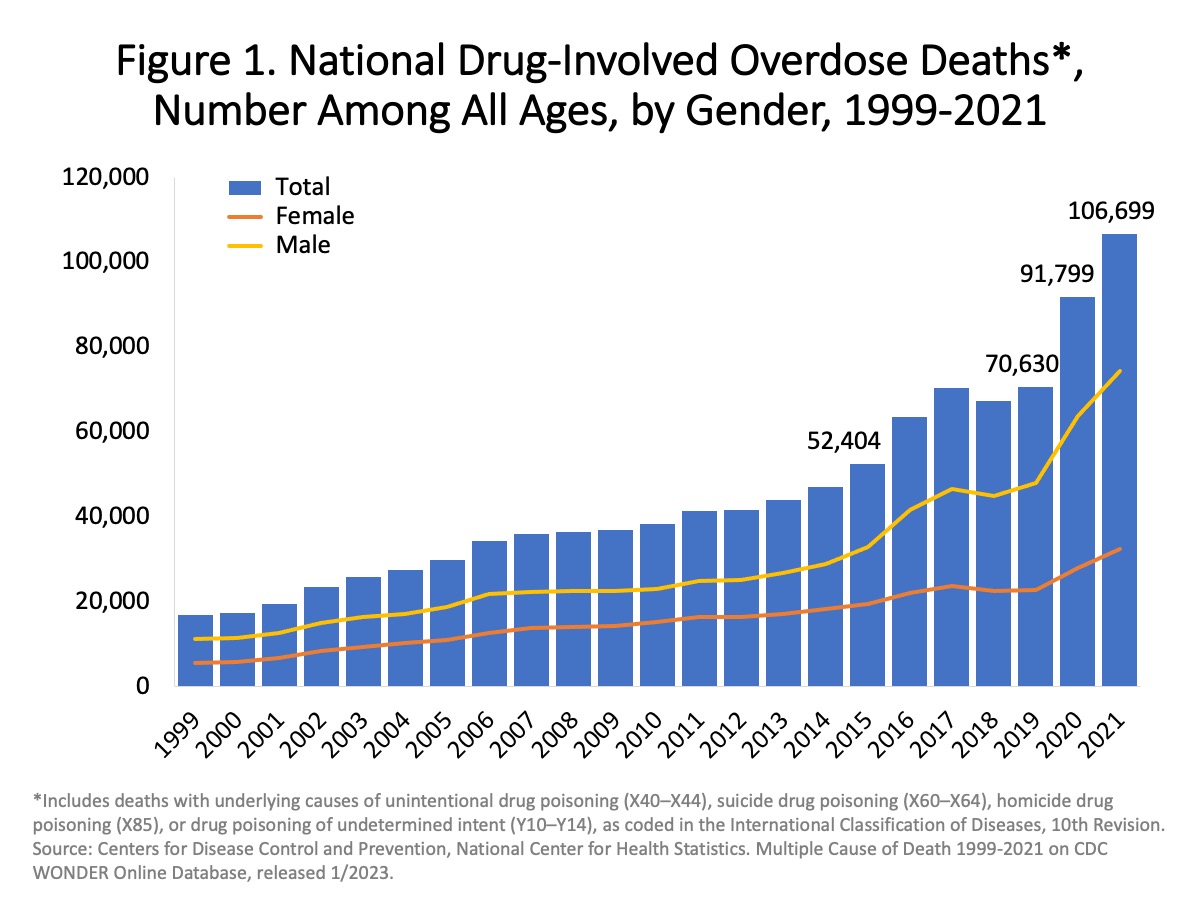
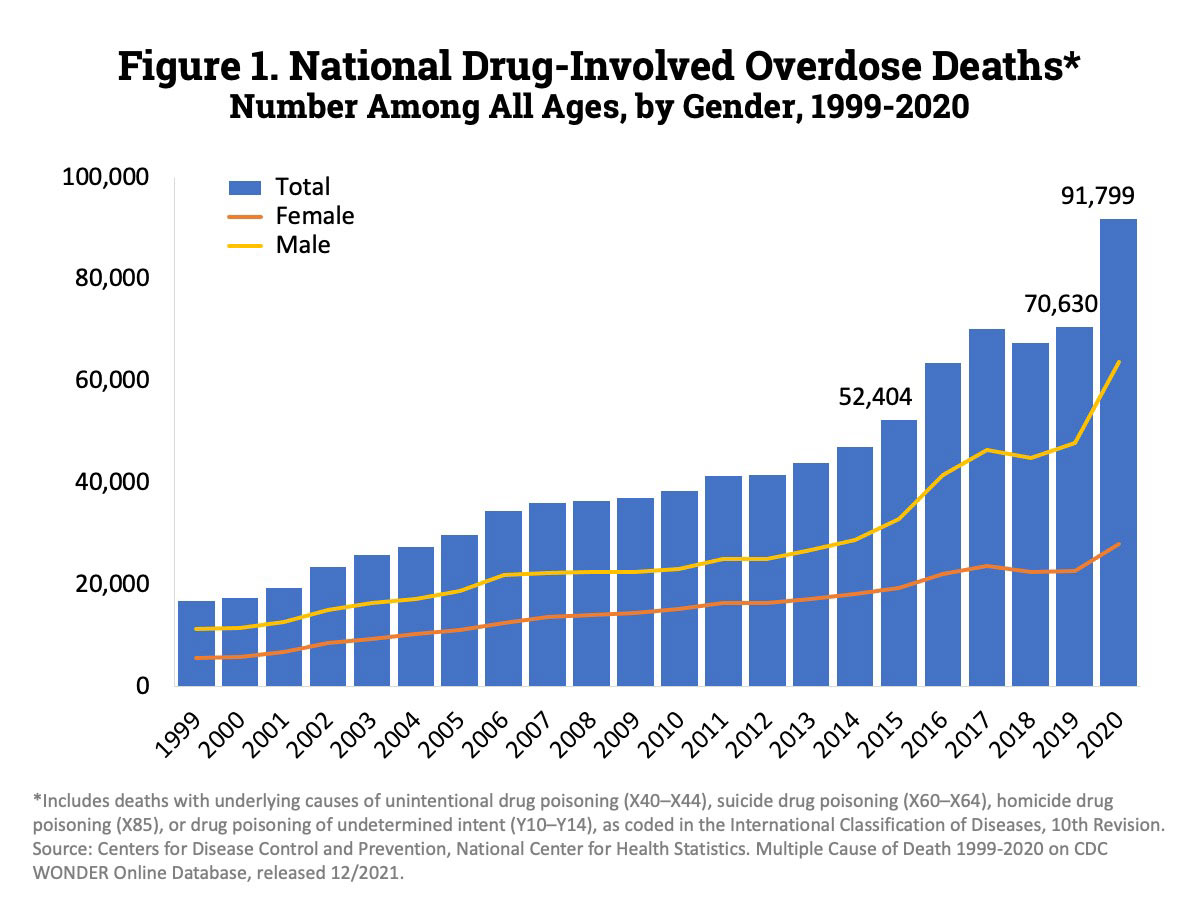
English: "Figure 1. National Drug-Involved Overdose Deaths—Number Among All Ages, by Gender, 1999-2020. Nearly 92,000 persons in the U.S. died from drug-involved overdose in 2020, including illicit drugs and prescription opioids. The figure above is a bar and line graph showing the total number of U.S. drug overdose deaths involving any illicit or prescription opioid drug from 1999 to 2020. The bars are overlaid by lines showing the number of deaths by gender from 1999 to 2020 (Source: CDC WONDER)." |
| Datum | - date of first upload here to the Commons. See file history for date of latest upload. |
| Zdroj | From Overdose Death Rates. By National Institute on Drug Abuse (NIDA). Click on the chart on the compilation page. The large chart will show up. Right-click it, and then "Open image in new tab" to get image URL. 1999-2021 chart. 1999-2020 chart. 1999-2019 chart. 2002-2017 chart. 1999-2017 chart. 2002-2015 chart. |
| Autor | National Institute on Drug Abuse. Some of the charts were cropped to get rid of outer white space. The caption and legend text were edited in some charts. The edited charts were put under the same public domain license. See Commons:Convert tables and charts to wiki code or image files, and the section about removing, adding, and editing text on chart images. |
Licence
This image is a work of the National Institutes of Health, part of the United States Department of Health and Human Services, taken or made as part of an employee's official duties. As a work of the U.S. federal government, the image is in the public domain.
 |
||
| Bylo zjištěno, že u tohoto souboru nejsou známa žádná omezení daná autorským právem a právy s ním souvisejícími. | ||
Historie souboru
Kliknutím na datum a čas se zobrazí tehdejší verze souboru.
| Datum a čas | Náhled | Rozměry | Uživatel | Komentář | |
|---|---|---|---|---|---|
| současná | 12. 7. 2023, 18:47 | | 1 200 × 900 (180 KB) | Timeshifter | Latest |
| 29. 5. 2022, 23:21 |  | 1 200 × 900 (153 KB) | Timeshifter | Latest version | |
| 13. 3. 2021, 18:27 |  | 1 106 × 524 (130 KB) | Timeshifter | Latest version. | |
| 16. 8. 2019, 19:52 |  | 869 × 675 (128 KB) | Timeshifter | Newer version. | |
| 5. 9. 2018, 17:32 |  | 813 × 583 (96 KB) | Timeshifter | new version | |
| 27. 3. 2017, 13:42 |  | 840 × 643 (103 KB) | Timeshifter | Added border | |
| 21. 3. 2017, 04:17 |  | 837 × 641 (96 KB) | Timeshifter | User created page with UploadWizard |
Využití souboru
Tento soubor používají následující 2 stránky:
Globální využití souboru
Tento soubor využívají následující wiki:
- Využití na de.wikipedia.org
- Využití na en.wikipedia.org
- Substance abuse
- Drug overdose
- 21st century
- Healthcare in the United States
- Political positions of Bernie Sanders
- Presidency of Donald Trump
- Opioid epidemic in the United States
- United States drug overdose death rates and totals over time
- Presidency of Joe Biden
- User:RogerNiceEyes/march2021
- User:Timeshifter/Archive 2
- Využití na es.wikipedia.org
- Využití na et.wikipedia.org
- Využití na sr.wikipedia.org
- Využití na www.wikidata.org
- Využití na zh.wikipedia.org