
Soubor:USDebt.png
Původní soubor (744 × 1 004 pixelů, velikost souboru: 53 KB, MIME typ: image/png)
| Tento soubor pochází z Wikimedia Commons. Níže jsou zobrazeny informace, které obsahuje jeho tamější stránka s popisem souboru. |

|
K tomuto obrázku existuje vektorová verze (v SVG). Pokud je lepší, používejte raději tu.
File:USDebt.png → File:USdebt.svg
Podrobnější informace o vektorové grafice najdete na stránce Commons:Transition to SVG. Také si můžete přečíst informace o podpoře formátu SVG v MediaWiki. |
 |
Popis
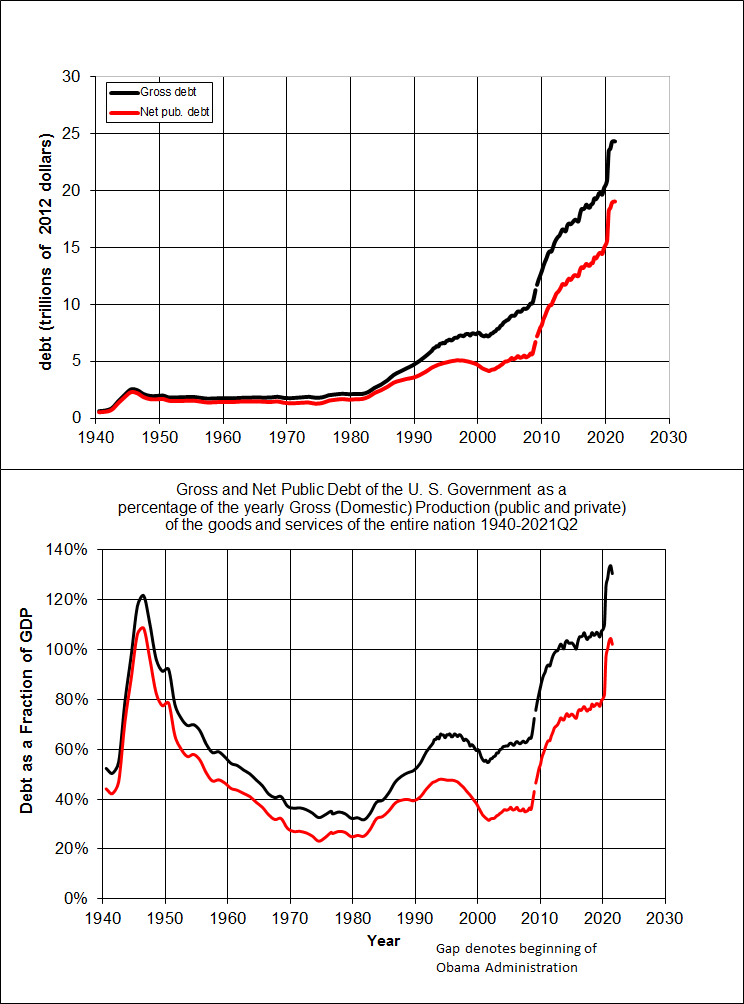
| Popis | U.S. debt from 1940 to 2010. Red lines indicate the Debt Held by the Public (net public debt) and black lines indicate the Total Public Debt Outstanding (gross public debt), the difference being that the gross debt includes that held by the federal government itself. The second panel shows the two debt figures as a percentage of U.S. GDP (dollar value of U.S. economic production for that year). The top panel is deflated so every year is in 2010 dollars. |
| Datum | |
| Zdroj |
United States Government Originally uploaded by O18 (talk) to en:Wikipedia (log). |
| Autor | en:User:O18 |
| Svolení (Užití tohoto souboru) |
Tento soubor podléhá licenci Creative Commons Uveďte autora-Zachovejte licenci 3.0 Unported
|
Data sources
Data for 1940-2010 are available from the United States Government at http://www.whitehouse.gov/omb/budget/Historicals archive copy at the Wayback Machine
- Debt (nominal and percentage of GDP): table 7.1
- Deflator (composite outlay deflator): table 1.3 or 10.1
Table description:
- year: fiscal year
- gross federal debt dollars: (nominal) gross federal debt (millions)
- total public dollars: (nominal) federal debt held by the public, ie, net of that held by federal govt (millions)
- deflator: composite outlay deflator (indexed to 2005)
- gross federal debt gdp: gross federal debt over fiscal year GDP (on same nominal/real basis)
- total public gdp: federal debt held by the public over fiscal year GDP (on same nominal/real basis)
Evidence against bias:
- the gross federal debt dollars series agrees well with the Oct, 23 AP report ("U.S. Debt Past $1 Trillion") that the debt first passed 1 Trillion dollars that day.
- The gross federal debt gdp in 2007 is the ratio of the nominal GDP from CIA fact book in 2007 over the nominal debt from table 7.1 in the reference.
Tabled data
This data tabled directly from the source (Presidents FY2012 budget). Note: deflators are applied when graphing in the code below, and it is deflated to the stated year (now 2010).
"year","gross.federal.debt.dollars","total.public.dollars","deflator","gross.federal.debt.gdp","total.public.gdp"
1940,50696,42772,0.0804,52.4,44.2
1941,57531,48223,0.0836,50.4,42.3
1942,79200,67753,0.0936,54.9,47.0
1943,142648,127766,0.1026,79.1,70.9
1944,204079,184796,0.0949,97.6,88.3
1945,260123,235182,0.0905,117.5,106.2
1946,270991,241861,0.0906,121.7,108.6
1947,257149,224339,0.1000,110.3,96.2
1948,252031,216270,0.1058,98.4,84.5
1949,252610,214322,0.1024,93.2,79.1
1950,256853,219023,0.1064,94.1,80.2
1951,255288,214326,0.1047,79.6,66.9
1952,259097,214758,0.1041,74.3,61.6
1953,265963,218383,0.1124,71.3,58.6
1954,270812,224499,0.1163,71.8,59.5
1955,274366,226616,0.1203,69.5,57.4
1956,272693,222156,0.1263,63.8,52.0
1957,272252,219320,0.1327,60.5,48.7
1958,279666,226336,0.1405,60.7,49.2
1959,287465,234701,0.1460,58.5,47.8
1960,290525,236840,0.1466,56.1,45.7
1961,292648,238357,0.1507,55.1,44.9
1962,302928,248010,0.1511,53.4,43.7
1963,310324,253978,0.1579,51.8,42.4
1964,316059,256849,0.1599,49.4,40.1
1965,322318,260778,0.1620,46.9,38.0
1966,328498,263714,0.1658,43.6,35.0
1967,340445,266626,0.1700,41.9,32.8
1968,368685,289545,0.1765,42.5,33.4
1969,365769,278108,0.1881,38.6,29.3
1970,380921,283198,0.1991,37.6,28.0
1971,408176,303037,0.2133,37.8,28.1
1972,435936,322377,0.2283,37.0,27.4
1973,466291,340910,0.2412,35.7,26.1
1974,483893,343699,0.2621,33.6,23.9
1975,541925,394700,0.2889,34.7,25.3
1976,628970,477404,0.3117,36.2,27.5
1977,706398,549104,0.3371,35.8,27.8
1978,776602,607126,0.3588,35.0,27.4
1979,829467,640306,0.3902,33.2,25.6
1980,909041,711923,0.4318,33.3,26.1
1981,994828,789410,0.4789,32.6,25.8
1982,1137315,924575,0.5136,35.2,28.6
1983,1371660,1137268,0.5393,39.9,33.1
1984,1564586,1306975,0.5675,40.7,34.0
1985,1817423,1507260,0.5868,43.9,36.4
1986,2120501,1740623,0.6020,48.1,39.5
1987,2345956,1889753,0.6210,50.5,40.6
1988,2601104,2051616,0.6398,51.9,41.0
1989,2867800,2190716,0.6634,53.1,40.6
1990,3206290,2411558,0.6840,55.9,42.1
1991,3598178,2688999,0.7162,60.7,45.3
1992,4001787,2999737,0.7436,64.1,48.1
1993,4351044,3248396,0.7637,66.1,49.3
1994,4643307,3433065,0.7780,66.6,49.2
1995,4920586,3604378,0.7992,67.0,49.1
1996,5181465,3734073,0.8184,67.1,48.4
1997,5369206,3772344,0.8356,65.4,45.9
1998,5478189,3721099,0.8436,63.2,43.0
1999,5605523,3632363,0.8554,60.9,39.4
2000,5628700,3409804,0.8767,57.3,34.7
2001,5769881,3319615,0.8988,56.4,32.5
2002,6198401,3540427,0.9135,58.8,33.6
2003,6760014,3913443,0.9375,61.6,35.6
2004,7354673,4295544,0.9644,62.9,36.8
2005,7905316,4592229,1.0000,63.6,36.9
2006,8451350,4828972,1.0354,64.0,36.6
2007,8950744,5035129,1.0642,64.6,36.3
2008,9986082,5803050,1.1031,69.7,40.5
2009,11875851,7544707,1.1085,85.2,54.1
2010,13528807,9018941,1.1218,94.2,62.8
2011,14764222,10128206,1.1525,98.7,67.7
2012,16050921,11281131,1.175343,100.1,70.4
2013,16719434,11982713,1.190529,101.2,72.6
2014,17794483,12779899,1.208930,103.3,74.2
2015,18120106,13116692,1.216690,101.2,73.3
2016,19539445,14167725,1.226666,106.1,77.0
July 29, 2021 Comprehensive revision: debt from U.S. Treasury website, GDP and deflators from BEA table, Debt/GDP ratio calculated from foregoing
Program
The image was made with R using the following code after setting the working directory properly.
#setwd("~/")  # <- you have to change this to a folder on your computer
dat <- read.csv("debt.txt") # <- you have to put the above data as debt.txt in the folder
bitmap(file="USDebt.png",type="png256",width=6,height=7,res=300,pointsize=14)
par(mfrow=c(2,1))
par(mar=c(2,3.5,0.1,1))
par(las=1)
par(yaxs="i")
par(mgp=c(2.1,0.6,0))
dat$deflator <- dat$deflator / dat$deflator[dat$year==2010]
plot(range(dat$year),range(1.04 * c(0,dat$gross.federal.debt.dollars/dat$deflator/1e6)),type="n",xlab="debt",ylab="debt (trillions of 2010 dollars)",lwd=3)
lines(dat$year,dat$gross.federal.debt.dollars/dat$deflator/1e6,lwd=3)


lines(dat$year,dat$total.public.dollars/dat$deflator/1e6,type="l",col="red",lwd=3)
legend("topleft",lwd=3,col=c("black","red"),legend=c("gross debt","public debt"),bty="n")
par(mar=c(2,3.5,0.1,1))
plot(range(dat$year),range(1.04 * c(0,dat$gross.federal.debt.gdp,dat$total.public.gdp)),type="n",xlab="year",ylab="debt as a % of gdp")
lines(dat$year,dat$gross.federal.debt.gdp,type="l",lwd=3)
lines(dat$year,dat$total.public.gdp,type="l",col="red",lwd=3)
dev.off()
Historie souboru
Kliknutím na datum a čas se zobrazí tehdejší verze souboru.
| Datum a čas | Náhled | Rozměry | Uživatel | Komentář | |
|---|---|---|---|---|---|
| současná | 2. 8. 2021, 00:19 | | 744 × 1 004 (53 KB) | ResidentScholar | Updated to 2021Q2 with July 29, 2021 Bureau of Economic Analysis comprehensive update |
| 27. 6. 2017, 05:08 |  | 1 800 × 2 100 (39 KB) | O18 | updated data | |
| 5. 4. 2012, 19:53 |  | 1 800 × 2 100 (41 KB) | Pdbailey | ||
| 14. 3. 2011, 17:07 |  | 1 800 × 2 100 (40 KB) | Pdbailey | ||
| 14. 3. 2011, 17:05 |  | 1 800 × 2 100 (40 KB) | Pdbailey | ||
| 27. 2. 2011, 00:39 |  | 1 173 × 1 443 (27 KB) | ResidentScholar~commonswiki | The previous version of this file had a legend saying 2009 deflator, but had data for a 2005 deflator. There was substantial inflation between 2005 and 2010, so the adjustment is quite noticeable: my point being that the price increases did not take pla | |
| 31. 3. 2010, 15:28 |  | 1 800 × 2 100 (40 KB) | Pdbailey | ||
| 31. 3. 2010, 01:58 |  | 1 800 × 2 100 (40 KB) | Pdbailey | ||
| 23. 9. 2009, 19:32 |  | 1 800 × 2 100 (40 KB) | Pdbailey | Update to take comments into account | |
| 19. 6. 2009, 14:49 |  | 1 800 × 2 100 (41 KB) | Nick Anfinsen | {{Information |Description===Data sources== Data for 1940-2007 are available from the United States Government * Debt (nominal and percentage of GDP): [http://www.whitehouse.gov/omb/budget/fy2009/pdf/hist.pdf], table 7.1 * Deflator (composite outlay defl |
Využití souboru
Tento soubor používá následující stránka:
Globální využití souboru
Tento soubor využívají následující wiki:
- Využití na da.wikipedia.org
- Využití na en.wikipedia.org
- Využití na es.wikipedia.org
- Využití na et.wikipedia.org
- Využití na hy.wikipedia.org
- Využití na ms.wikipedia.org
- Využití na nl.wikipedia.org
- Využití na no.wikipedia.org
- Využití na sv.wikipedia.org
- Využití na tr.wikipedia.org
- Využití na uz.wikipedia.org
- Využití na vi.wikipedia.org
- Využití na zh.wikipedia.org