
Soubor:Temperature reconstruction last two millennia cs.svg

Původní soubor (soubor SVG, nominální rozměr: 485 × 325 pixelů, velikost souboru: 109 KB)
| Tento soubor pochází z Wikimedia Commons. Níže jsou zobrazeny informace, které obsahuje jeho tamější stránka s popisem souboru. |
Popis

|
Tento soubor ve formátu SVG obsahuje vložený text či texty, které lze přeložit do češtiny. K překladu je možné použít některé vektorové editory, textový editor nebo nástroj SVG Překladač. Pro více informací navštivte Nápovědu k překladům souborů SVG. |
| Popis |
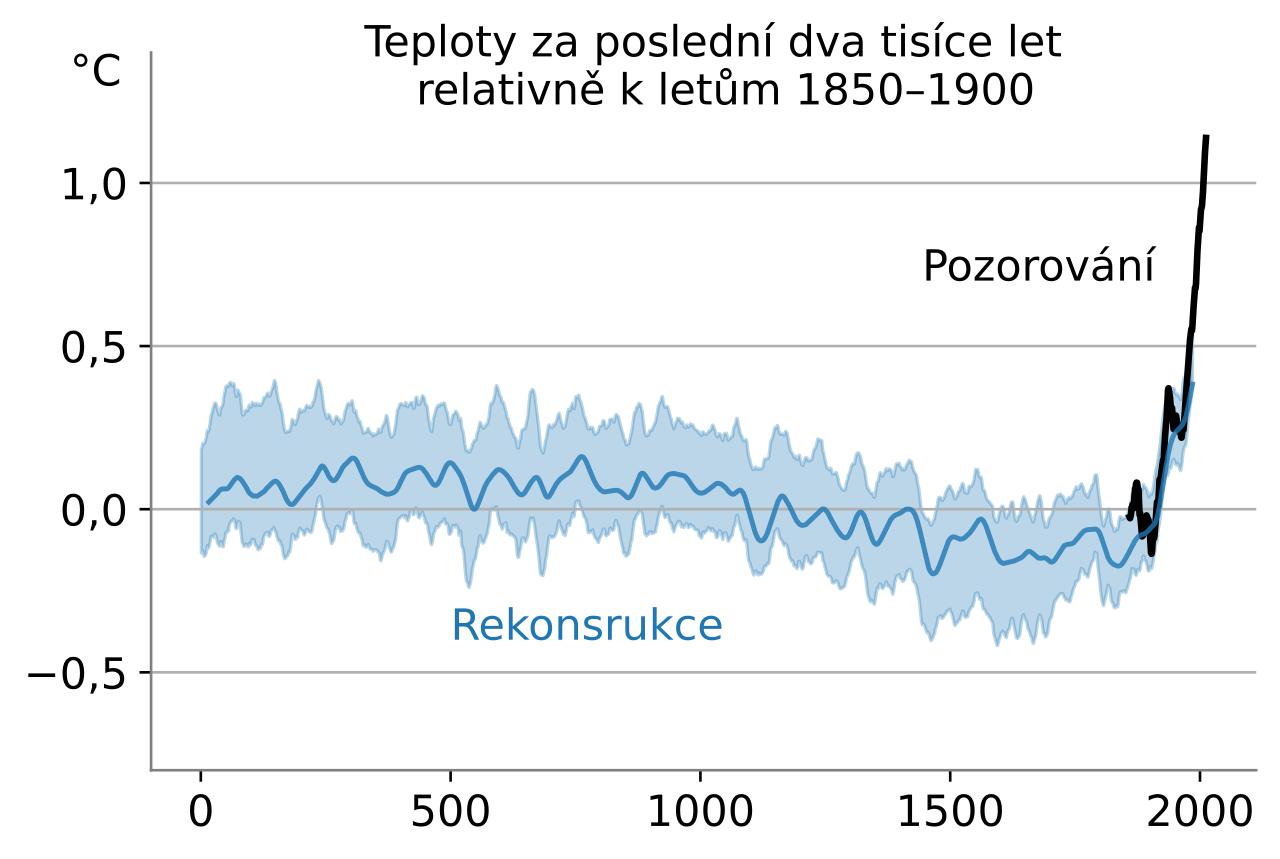
English: Temperatures with respect to the 1850–1900 mean over the last 2 millennia (blue) and observational estimates ranging from 1850 to 2020 (black). The shaded region contains the 68% confidence interval. The temperature anomalies are from the 2019 Nature Geoscience paper by the Pages2k Consortium.[1] using a wide set of proxies that have been vetted by the same consortium.[2] They include tree ring data, data from corals and ice core data.
The confidence interval incorporates two sources of uncertainty. The first one derives from the the method of translating information in the proxies into temperatures. Seven different peer-reviewed methods are employed and all considered equally likely in the figure. The methods range from a simple linear method where proxies sensitivities are fitted to the observational to determine past temperature, to more complicated methods in which information about spatial patterns is taken into account, or information about natural forcing is taken into account. The second type of uncertainty is in the selection of proxies. Some proxies might not be entirely reliable and their inclusion might slightly bias the reconstruction. By randomly selecting a subset of proxies, this uncertainty can be quantified. Code to create the figure is adapted from the Nature Geosciences paper[1] and can be found on https://figshare.com/collections/Global_mean_temperature_reconstructions_over_the_Common_Era/4507043. The figure is a simplification of Fig 1a from this paper. Individual reconstruction methods are not shown. The observational data is HadCRUT5, plotted with a ten-year running mean.[3] references
|
| Datum | |
| Zdroj | Vlastní dílo |
| Autor | Femke Nijsse, Czech translation Jirka Dl |
| Další verze |
The above two-millennia chart is included in the following composites:
|


Licence
- Dílo smíte:
- šířit – kopírovat, distribuovat a sdělovat veřejnosti
- upravovat – pozměňovat, doplňovat, využívat celé nebo částečně v jiných dílech
- Za těchto podmínek:
- uveďte autora – Máte povinnost uvést autorství, poskytnout odkaz na licenci a uvést, pokud jste provedli změny. Toho můžete docílit jakýmkoli rozumným způsobem, avšak ne způsobem naznačujícím, že by poskytovatel licence schvaloval nebo podporoval vás nebo vaše užití díla.
- zachovejte licenci – Pokud tento materiál jakkoliv upravíte, přepracujete nebo použijete ve svém díle, musíte své příspěvky šířit pod stejnou nebo slučitelnou licencí jako originál.
Historie souboru
Kliknutím na datum a čas se zobrazí tehdejší verze souboru.
| Datum a čas | Náhled | Rozměry | Uživatel | Komentář | |
|---|---|---|---|---|---|
| současná | 11. 10. 2023, 21:04 | | 485 × 325 (109 KB) | Jirka Dl | Uploaded own work with UploadWizard |
Využití souboru
Tento soubor používá následující stránka: