
Soubor:20211109 Frequency of extreme weather for different degrees of global warming - bar chart IPCC AR6 WG1 SPM.svg

Velikost tohoto PNG náhledu tohoto SVG souboru: 800 × 450 pixelů. Jiná rozlišení: 320 × 180 pixelů | 640 × 360 pixelů | 1 024 × 576 pixelů | 1 280 × 720 pixelů | 2 560 × 1 440 pixelů | 1 200 × 675 pixelů.
Původní soubor (soubor SVG, nominální rozměr: 1 200 × 675 pixelů, velikost souboru: 5 KB)
| Tento soubor pochází z Wikimedia Commons. Níže jsou zobrazeny informace, které obsahuje jeho tamější stránka s popisem souboru. |
Popis
| Popis |
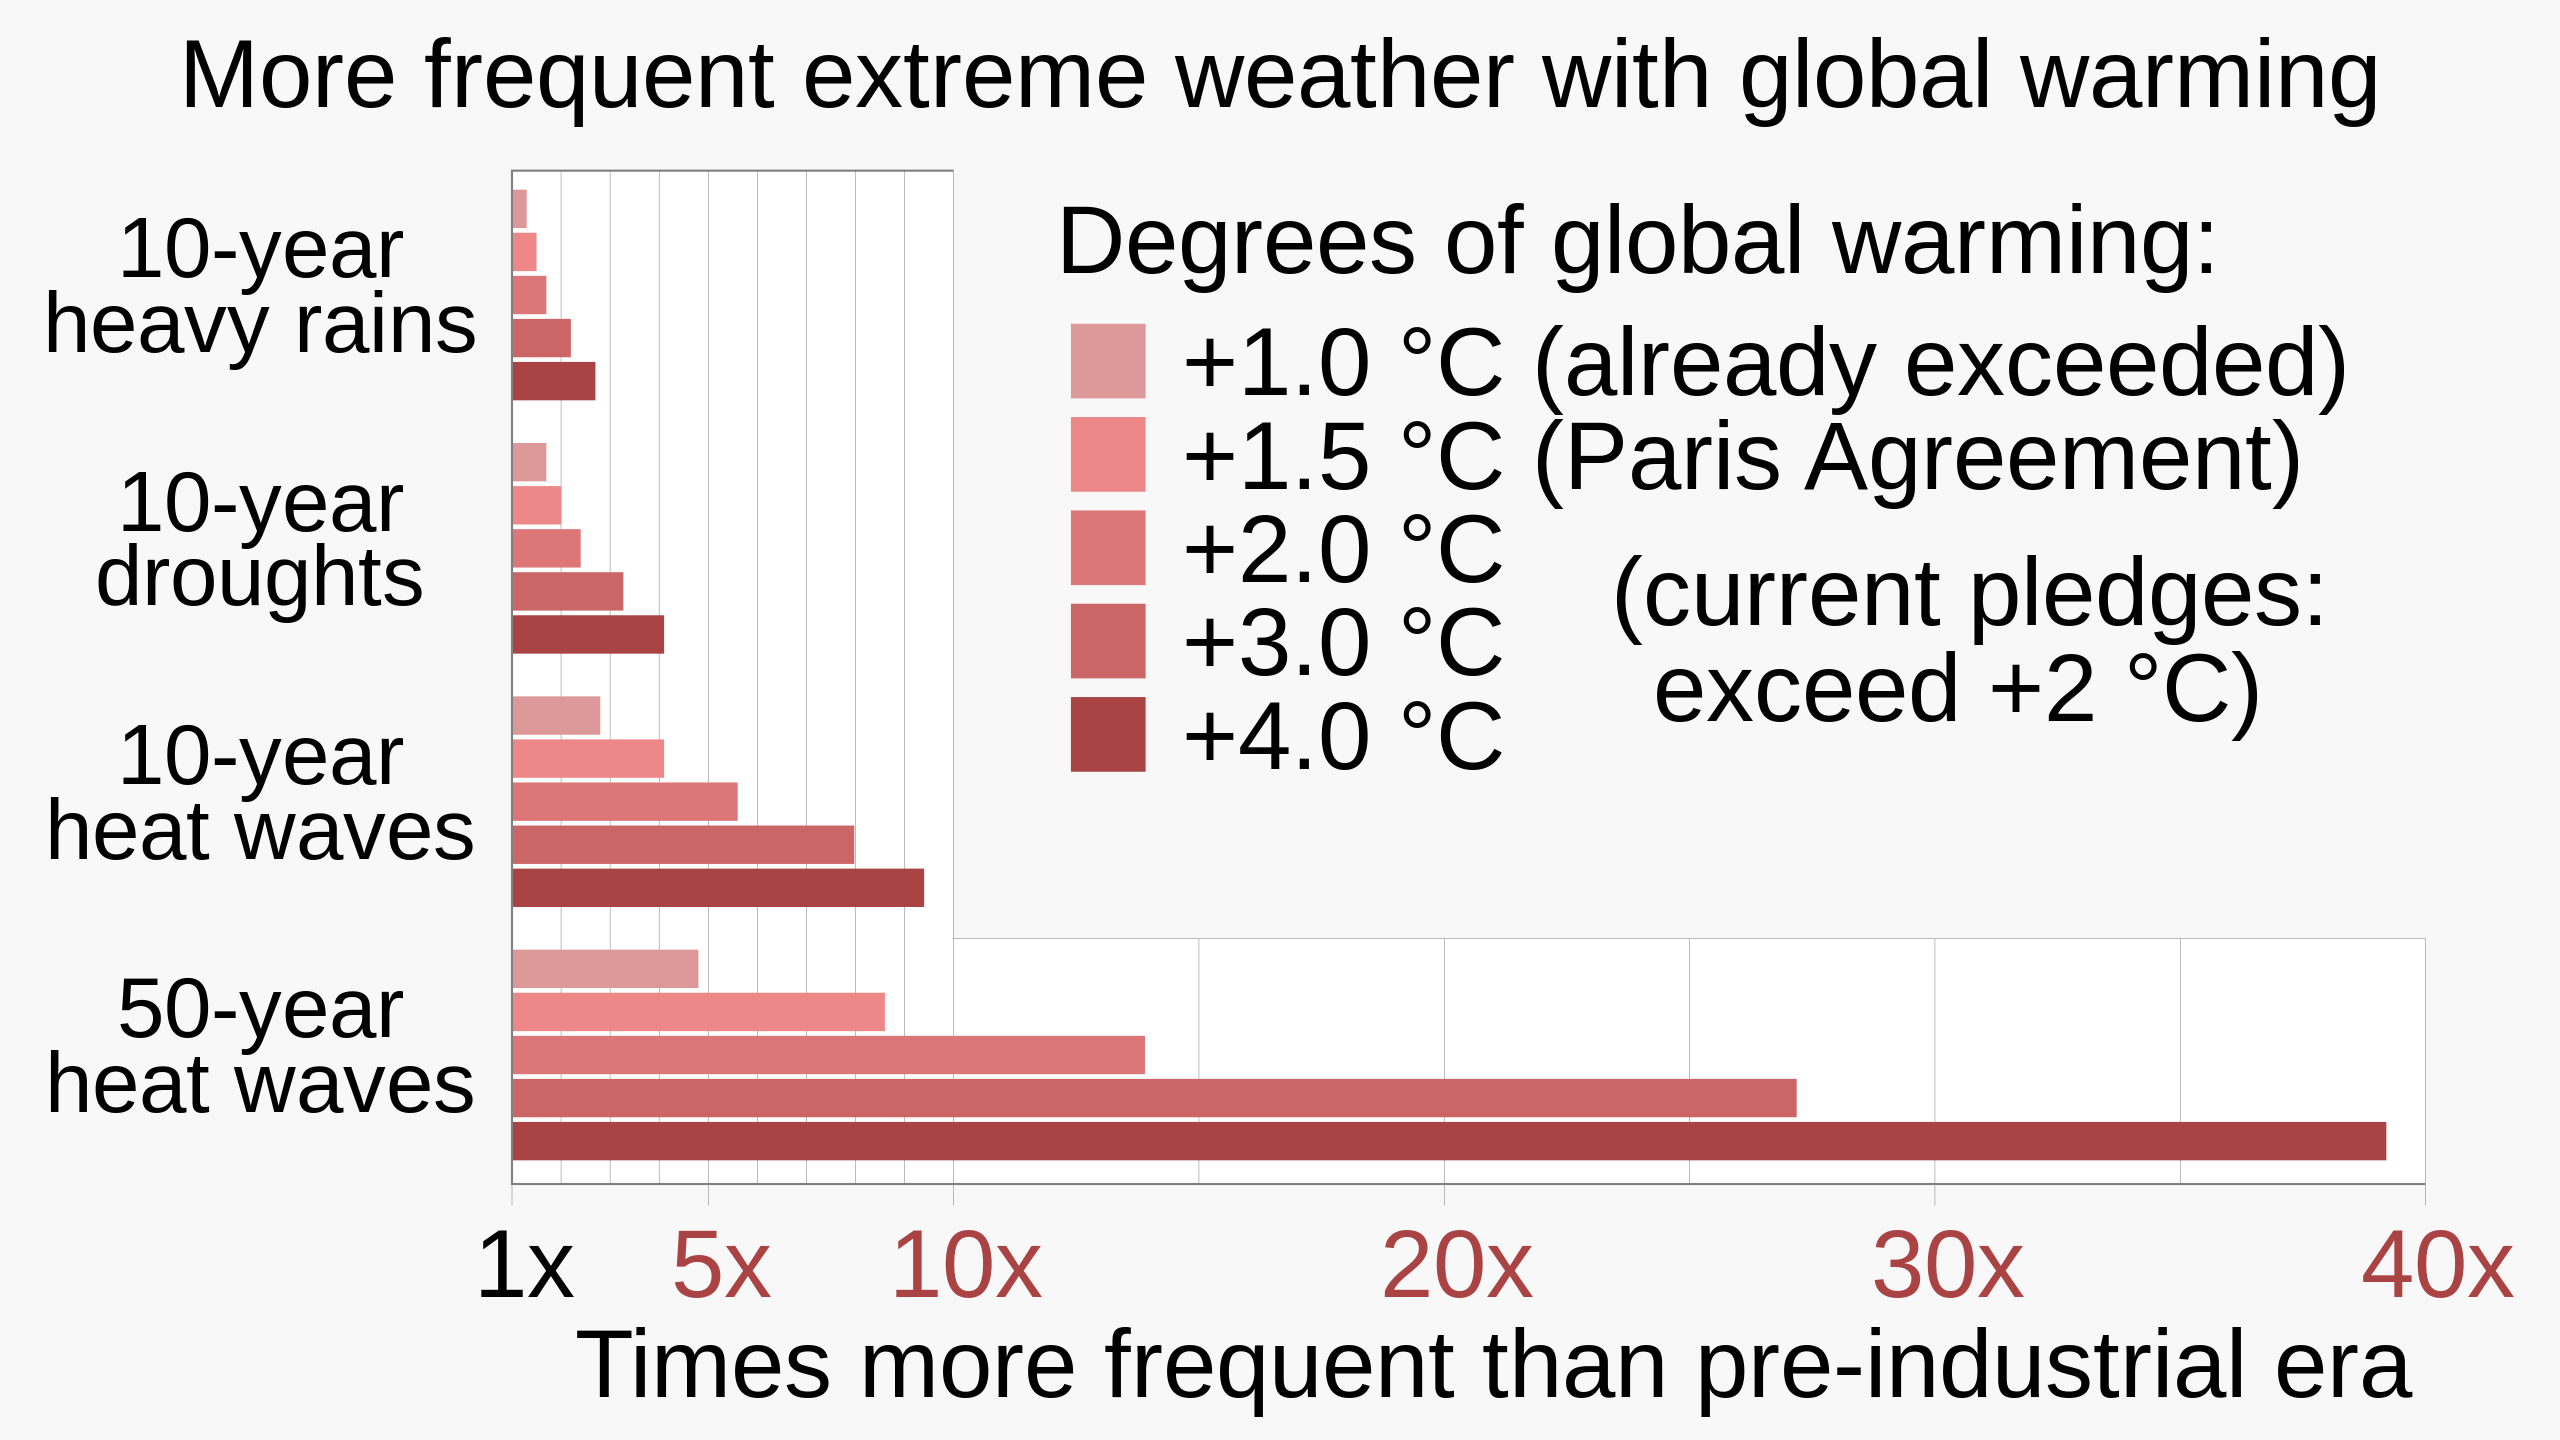
English: Bar chart showing frequency of extreme weather for different degrees of global warming, based on data from IPCC AR6 WG1 SPM (Summary for Policy Makers).
|
||||
| Datum | |||||
| Zdroj | Vlastní dílo | ||||
| Autor | RCraig09 | ||||
| Další verze |
|


Related files
The following files are based on Fig. SPM.6 of the Sixth Assessment Report of the Intergovernmental Panel on Climate Change / Summary for Policymakers:
-
 20210809 Projected extremes for different degrees of global warming - IPCC AR6 WG1 SPM.svg
9 August 2021: Line chart of 10- and 50-year datasets (includes frequency, omits intensity) -
 20211107 Projected extremes for different degrees of global warming - 3x10yr area chart - IPCC AR6 WG1 SPM.svg
7 Nov 2021: "L" charts includes both frequency and intensity of the 10-year datasets (omits 50-year dataset) -
 20211109 Frequency of extreme weather for different degrees of global warming - bar chart IPCC AR6 WG1 SPM.svg
9 Nov 2021: Bar chart of 10- and 50-year datasets (includes frequency, omits intensity) -
 20220208 Projected temperature extremes for different degrees of global warming - orthogonal bar chart - IPCC AR6 WG1 SPM.svg
Orthogonal bar chart of 10-year heat waves (only)


Licence
Já, držitel autorských práv k tomuto dílu, ho tímto zveřejňuji za podmínek následující licence:
Tento soubor podléhá licenci Creative Commons Uveďte autora-Zachovejte licenci 4.0 International
- Dílo smíte:
- šířit – kopírovat, distribuovat a sdělovat veřejnosti
- upravovat – pozměňovat, doplňovat, využívat celé nebo částečně v jiných dílech
- Za těchto podmínek:
- uveďte autora – Máte povinnost uvést autorství, poskytnout odkaz na licenci a uvést, pokud jste provedli změny. Toho můžete docílit jakýmkoli rozumným způsobem, avšak ne způsobem naznačujícím, že by poskytovatel licence schvaloval nebo podporoval vás nebo vaše užití díla.
- zachovejte licenci – Pokud tento materiál jakkoliv upravíte, přepracujete nebo použijete ve svém díle, musíte své příspěvky šířit pod stejnou nebo slučitelnou licencí jako originál.
Historie souboru
Kliknutím na datum a čas se zobrazí tehdejší verze souboru.
| Datum a čas | Náhled | Rozměry | Uživatel | Komentář | |
|---|---|---|---|---|---|
| současná | 29. 7. 2023, 22:44 | | 1 200 × 675 (5 KB) | RCraig09 | Version 12: remove <tspan> declarations embedded within <text> in the title "More frequent...", to work around ongoing text rendering problems on Wikimedia |
| 29. 7. 2023, 22:29 |  | 1 200 × 675 (5 KB) | RCraig09 | Version 11: manually changing "+1.1 °C today" to "(already exceeded)" (in the English language portion) to future-proof this graphic . . . . retained JP translation <switch> elements without change | |
| 6. 9. 2022, 06:57 |  | 1 200 × 675 (5 KB) | Icosohedral | File uploaded using svgtranslate tool (https://svgtranslate.toolforge.org/). Added translation for zh. | |
| 21. 12. 2021, 19:19 |  | 1 200 × 675 (3 KB) | RCraig09 | Version 9: misc changes per suggestions on this file's Talk page. | |
| 22. 11. 2021, 07:31 |  | 1 200 × 675 (3 KB) | RCraig09 | Version 8: more exact 3.0 C values . . . colors of horizontal axis tick labels | |
| 18. 11. 2021, 05:40 |  | 1 200 × 675 (3 KB) | RCraig09 | Version 7: adding to legend, 2.7 C under current pledges, per discussions at en.wp's Talk:Climate change | |
| 17. 11. 2021, 06:58 |  | 1 200 × 675 (4 KB) | RCraig09 | Version 6: Enlarge some font sizes . . . . change some text | |
| 16. 11. 2021, 08:07 |  | 1 200 × 675 (4 KB) | RCraig09 | Version 5: Used Liberation Sans . . . changed legend to "Present-day =+1.1 C" | |
| 13. 11. 2021, 20:25 |  | 1 200 × 675 (4 KB) | RCraig09 | Version 4: includes thinner, white vertical gridlines that overlay the colored bars, to make it easier to determine extent of the bars. Darker, wider gridlines remain behind the gridlines so they're visible over the white background. | |
| 13. 11. 2021, 06:21 |  | 1 200 × 675 (4 KB) | RCraig09 | Version 3: reduced length of some vertical grid lines; removed most of the plot-area outline. |
Využití souboru
Tento soubor nepoužívá žádná stránka.
Globální využití souboru
Tento soubor využívají následující wiki:
- Využití na bn.wikipedia.org
- Využití na de.wikipedia.org
- Využití na en.wikipedia.org
- Využití na eo.wikipedia.org
- Využití na ko.wikipedia.org
- Využití na ms.wikipedia.org
- Využití na pt.wikipedia.org
- Využití na ru.wikipedia.org
- Využití na rw.wikipedia.org
- Využití na tr.wikipedia.org
- Využití na zh.wikipedia.org