
Soubor:1951+ Percent of global area at temperature records - Seasonal comparison - NOAA.svg

Velikost tohoto PNG náhledu tohoto SVG souboru: 800 × 560 pixelů. Jiná rozlišení: 320 × 224 pixelů | 640 × 448 pixelů | 1 024 × 717 pixelů | 1 280 × 896 pixelů | 2 560 × 1 792 pixelů | 2 000 × 1 400 pixelů.
Původní soubor (soubor SVG, nominální rozměr: 2 000 × 1 400 pixelů, velikost souboru: 22 KB)
| Tento soubor pochází z Wikimedia Commons. Níže jsou zobrazeny informace, které obsahuje jeho tamější stránka s popisem souboru. |
Popis
| Popis |
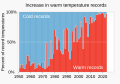
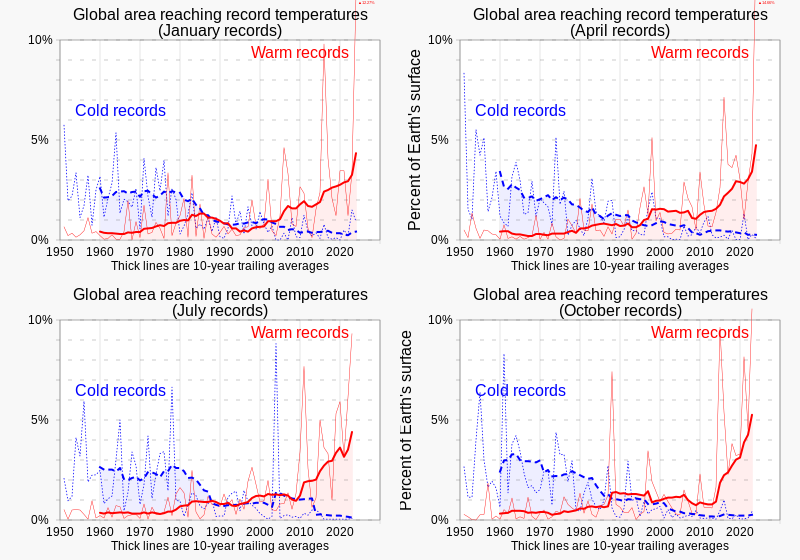
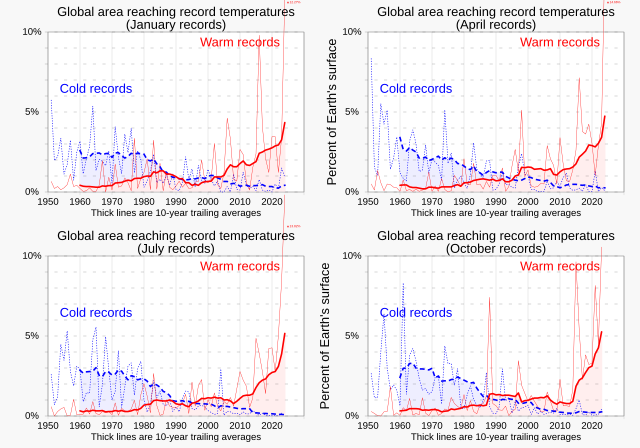
English: Charts comparing percentages of Earth's surface reaching record temperatures since 1951, comparing records for January, April, July and October, from NOAA data.
|
||
| Datum | |||
| Zdroj | Vlastní dílo | ||
| Autor | RCraig09 |

Related files
-
 01 January - Percent of global area at temperature records - Global warming - NOAA.svg
(January data) -
 02 February - Percent of global area at temperature records - Global warming - NOAA.svg
(February data) -
 03 March - Percent of global area at temperature records - Global warming - NOAA.svg
(March data) -
 04 April - Percent of global area at temperature records - Global warming - NOAA.svg
(April data) -
 05 May - Percent of global area at temperature records - Global warming - NOAA.svg
(May data) -
 06 June - Percent of global area at temperature records - Global warming - NOAA.svg
(June data)


-
 07 July - Percent of global area at temperature records - Global warming - NOAA.svg
(July data) -
 08 August - Percent of global area at temperature records - Global warming - NOAA.svg
(August data) -
 09 September - Percent of global area at temperature records - Global warming - NOAA.svg
(September data) -
 10 October - Percent of global area at temperature records - Global warming - NOAA.svg
(October data) -
 11 November - Percent of global area at temperature records - Global warming - NOAA.svg
(November data) -
 12 December - Percent of global area at temperature records - Global warming - NOAA.svg
(December data)


-
 1951+ Percent of global area at temperature records - Seasonal comparison - NOAA.svg
Seasonal comparison -
 1951 - Percent of global area at temperature records (monthly) - Global warming - NOAA.svg
All months scatterplot/dot plot -
 1951- RATIO of new record warm temperatures to new record cold temperatures (monthly) - Global warming.svg
Ratios scatterplot/dot plot (monthly) -
 1951- Percent of record temperatures that are cold or warm records.svg
 -
 1951- Warm and cold record temperatures - bar chart.svg

_-_Global_warming_-_NOAA.svg)
_-_Global_warming.svg)


Licence
Já, držitel autorských práv k tomuto dílu, ho tímto zveřejňuji za podmínek následující licence:
Tento soubor podléhá licenci Creative Commons Uveďte autora-Zachovejte licenci 4.0 International
- Dílo smíte:
- šířit – kopírovat, distribuovat a sdělovat veřejnosti
- upravovat – pozměňovat, doplňovat, využívat celé nebo částečně v jiných dílech
- Za těchto podmínek:
- uveďte autora – Máte povinnost uvést autorství, poskytnout odkaz na licenci a uvést, pokud jste provedli změny. Toho můžete docílit jakýmkoli rozumným způsobem, avšak ne způsobem naznačujícím, že by poskytovatel licence schvaloval nebo podporoval vás nebo vaše užití díla.
- zachovejte licenci – Pokud tento materiál jakkoliv upravíte, přepracujete nebo použijete ve svém díle, musíte své příspěvky šířit pod stejnou nebo slučitelnou licencí jako originál.
Historie souboru
Kliknutím na datum a čas se zobrazí tehdejší verze souboru.
| Datum a čas | Náhled | Rozměry | Uživatel | Komentář | |
|---|---|---|---|---|---|
| současná | 17. 5. 2024, 06:20 | | 2 000 × 1 400 (22 KB) | RCraig09 | Version 8: update to include new chart for April 2024 |
| 24. 2. 2024, 02:23 |  | 2 000 × 1 400 (23 KB) | RCraig09 | Version 7: Update to include chart showing data for January 2024 | |
| 16. 11. 2023, 07:38 |  | 2 000 × 1 400 (24 KB) | RCraig09 | Version 6: remove minor extraneous characters from October quadrant | |
| 16. 11. 2023, 07:34 |  | 2 000 × 1 400 (24 KB) | RCraig09 | Version 5: Update with October 2023 chart | |
| 15. 8. 2023, 05:57 |  | 2 000 × 1 400 (26 KB) | RCraig09 | Version 4: update to include July chart through 2023 | |
| 30. 7. 2023, 23:08 |  | 2 000 × 1 400 (27 KB) | RCraig09 | Version 3: Add April and October graphics, for four-season comparison | |
| 29. 7. 2023, 06:00 | 2 000 × 700 (13 KB) | RCraig09 | Version 2: re-centering some text strings | ||
| 29. 7. 2023, 00:37 | 2 000 × 700 (13 KB) | RCraig09 | Uploaded own work with UploadWizard |
Využití souboru
Tento soubor používá následující stránka:
Globální využití souboru
Tento soubor využívají následující wiki:
- Využití na ar.wikipedia.org
- Využití na bn.wikipedia.org
- Využití na en.wikipedia.org
- Využití na ha.wikipedia.org
- Využití na id.wikipedia.org
- Využití na mk.wikipedia.org
- Využití na zh.wikipedia.org