
Soubor:Operating systems used on top 500 supercomputers.svg

Velikost tohoto PNG náhledu tohoto SVG souboru: 800 × 480 pixelů. Jiná rozlišení: 320 × 192 pixelů | 1 024 × 614 pixelů | 1 280 × 768 pixelů | 2 560 × 1 536 pixelů | 1 200 × 720 pixelů.
Původní soubor (soubor SVG, nominální rozměr: 1 200 × 720 pixelů, velikost souboru: 47 KB)
| Tento soubor pochází z Wikimedia Commons. Níže jsou zobrazeny informace, které obsahuje jeho tamější stránka s popisem souboru. |
Popis
| Popis |
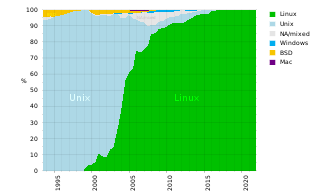
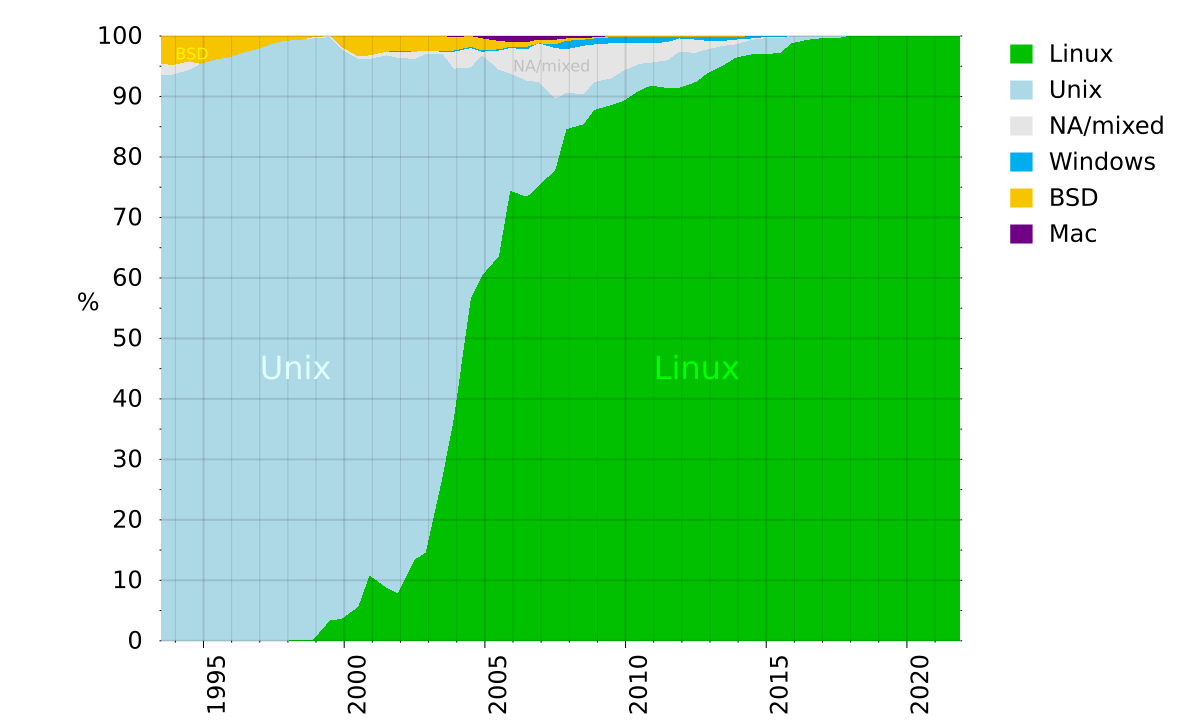
English: This figure shows the operating systems used on the supercomputers listed on the Top500 list. Data for this figure was compiled from http://top500.org/stats |
| Datum | |
| Zdroj | Eigenes Werk (own work) / source top500.org |
| Autor | Benedikt.Seidl |
| Další verze |
Díla odvozená od tohoto souboru: Operating systems used on top 500 supercomputers de.svg Image:Top500_OS.png |
Licence
| Já, autor tohoto díla, jej tímto uvolňuji jako volné dílo, a to celosvětově. V některých zemích to není podle zákona možné; v takovém případě: Poskytuji komukoli právo užívat toto dílo za libovolným účelem, a to bezpodmínečně s výjimkou podmínek vyžadovaných zákonem. |
W3C-validity not checked.
Verwendetes Script für Gnuplot
#!/usr/bin/gnuplot
#
# Gnuplot Script zur Erstellung des SVG-Dokuments
#

unset border

# using native size of 1200 * 720 = (2*2*2*2*3*5*5) * (2*2*2*2*3*3*5)
# so that size can be divided by 1, 2, 3, 4, 5, 6, 8, 10, 12, 15, 16, 20, 24, 30, 40, 48, 60, 80, 120, 240 without aliasing
set terminal svg size 1200 720 fname "DejaVu Sans,24" enhanced
set output "Operating_systems_used_on_top_500_supercomputers.svg"

set ylabel rotate by 0 "%" offset 3,1.0
set key invert reverse Left outside samplen 0.2
set xtics out  scale 0.4,0.1  rotate by 90 offset 0.8,character -1.4  1990,5,2038  nomirror
set ytics out  scale 0.1,0.1  0,10,100
set mxtics 5
set mytics 2
show mxtics
show mytics

set yrange [0:100]

set grid xtics mxtics ytics  front \
    linetype 3 linewidth 2 lc rgb "#e0000000",\
    linetype 3 linewidth 1 lc rgb "#e0000000"
show grid

set label "Unix"     at 1997,45 front font ",32" textcolor "light-cyan"
set label "Linux"    at 2011,45 front font ",32" textcolor "green"
set label "NA/mixed" at 2006,95 front font ",16" textcolor "grey95"
set label "BSD"      at 1994,97 front font ",16" textcolor "#fef000"
show label

plot \
'cpu.csv' using 1:(100-$7)      :(100)         title "Mac"      with filledcurves lt rgb "#6f0085" ,\
       '' using 1:($2+$4+$6+$3) :(100-$7)      title "BSD"      with filledcurves lt rgb "#f7c500" ,\
       '' using 1:($2+$4+$6)    :($2+$4+$6+$3) title "Windows"  with filledcurves lt rgb "#00adef" ,\
       '' using 1:($2+$4)       :($2+$4+$6)    title "NA/mixed" with filledcurves lt rgb "grey90" ,\
       '' using 1:($2)          :($2+$4)       title "Unix"     with filledcurves lt rgb "light-blue" ,\
       '' using 1:(0)           :($2)          title "Linux"    with filledcurves lt rgb "web-green"


#
# output same data with lines instead of filledcurves, plot two diagram in one
#
set output "Operating_systems_used_on_top_500_supercomputers_detail.svg"
set multiplot

#
# top plot
set size   1, 0.4
set origin 0, 0.6

set border
set bmargin 0.5

set yrange [0:100]

set xtics out  scale 0.5,0.3  rotate by 90 offset 0.8,character -1.4  1990,5,2038  nomirror
set ytics out  scale 0.2,0.2  0,20,100

# do not plot years in top plot
set format x ""
# do not plot legend in top plot
set key off
# use fixed width for y
set format y "%3g"

set ylabel rotate by 0 "%" offset 2.5,0

set grid xtics mxtics ytics  back \
    linetype 3 linewidth 2 dashtype 2 lc rgb "#e0000000",\
    linetype 3 linewidth 2 dashtype 3 lc rgb "#e0000000"

unset label

plot   '' using 1:2 title "Linux"    with lines lw 5 lt rgb "web-green" ,\
       '' using 1:4 title "Unix"     with lines lw 5 lt rgb "light-blue" , \
       '' using 1:5 title "BSD"      with lines lw 5 lt rgb "#f7c500" ,\
       '' using 1:3 title "Windows"  with lines lw 5 lt rgb "#00adef" ,\
       '' using 1:7 title "Mac"      with lines lw 5 lt rgb "#6f0085" ,\
       '' using 1:6 title "NA/mixed" with lines lw 5 lt rgb "grey80"

#
# bottom plot
set size   1, 0.6
set origin 0, 0.0

# plot years
set format x "%g"
set bmargin 5
set tmargin 0

set yrange [0:10]
set ytics out  scale 0.2,0.2  0,2,9
set key below horizontal samplen 0.2 box lt rgb "grey"

replot

unset multiplot

set term pop
The above script also generates another diagram with detail view.

Verwendete Daten
# year  linux   windows unix    bsd     na_mixed        mac
1993.5	0	0	93.60 	4.60 	1.80 	0
1993.9	0	0	93.60 	4.80 	1.60 	0
1994.5	0	0	94.40 	4.20 	1.40 	0
1994.9	0	0	95.40 	4.60 	0	0
1995.5	0	0	96.20 	3.80 	0	0
1995.9	0	0	96.40 	3.60 	0	0
1996.5	0	0	97.40 	2.60 	0	0
1996.9	0	0	97.80 	2.20 	0	0
1997.5	0	0	98.80 	1.20 	0	0
1997.9	0	0	99.20 	0.80 	0	0
1998.5	0.20 	0	99.20 	0.60 	0	0
1998.9	0.20 	0	99.40 	0.20 	0.20 	0
1999.5	3.40 	0	96.40 	0	0.20 	0
1999.9	3.60 	0	94.20 	1.80 	0.40 	0
2000.5	5.60 	0	90.60 	3.40 	0.40 	0
2000.9	10.80 	0	85.40 	3.20 	0.60 	0
2001.5	8.80 	0	88.00 	2.60 	0.60 	0
2001.9	7.80 	0.20 	88.60 	2.40 	1.00 	0
2002.5	13.40 	0	82.80 	2.60 	1.20 	0
2002.9	14.60 	0	82.40 	2.40 	0.60 	0
2003.5	27.20 	0.20 	69.80 	2.40 	0.40 	0
2003.9	36.80 	0.20 	57.80 	2.20 	2.80 	0.20
2004.5	56.60 	0.20 	38.20 	1.80 	3.20 	0
2004.9	60.40 	0.20 	36.40 	2.00 	0.60 	0.40
2005.5	63.60 	0.20 	30.80 	1.40 	3.20 	0.80
2005.9	74.40 	0.20 	19.40 	0.80 	4.20 	1.00
2006.5	73.40 	0.40 	19.20 	0.80 	5.20 	1.00
2006.9	75.20 	0	17.20 	0.60 	6.40 	0.60
2007.5	77.80 	0.60 	11.80 	0.80 	8.40 	0.60
2007.9	84.60 	1.40 	6.00 	0.40 	7.20 	0.40
2008.5	85.40 	1.00 	5.00 	0.20 	8.00 	0.40
2008.9	87.80 	1.00 	4.60 	0.20 	6.20 	0.20
2009.5  88.60   1.00    4.40    0.20    5.80    0
2009.9  89.20   1.00    5.00    0.20    4.60    0
2010.5  91.00   1.00    4.40    0.20    3.40    0
2010.9  91.80   1.00    3.80    0.20    3.20    0
2011.5  91.4    0.8     4.6     0.2     3.0     0       # as retrieved 2011-12-02
2011.9  91.4    0.2     6.0     0.2     2.2     0       # as retrieved 2011-12-02
2012.5  92.4    0.4     4.8     0.4     2.2     0       # as retrieved 2012-10-27 http://i.top500.org/stats
2012.9  93.8    0.6     4.0     0.2     1.4     0       # as retrieved 2012-11-12 http://www.top500.org/statistics/list
2013.5  95.2    0.6     3.2     0.2     0.8     0       # as retrieved 2013-06-19 http://www.top500.org/statistics/list
2013.9  96.4    0.4     2.2     0.2     0.8     0       # as retrieved 2013-11-18 http://www.top500.org/statistics/list
2014.5  97.0    0.4     2.4     0.0     0.2     0       # as retrieved 2014-06-23 http://www.top500.org/statistics/list
2014.9  97.0    0.2     2.6     0.0     0.2     0       # as retrieved 2014-11-17 http://www.top500.org/statistics/list
2015.5  97.2    0.2     2.4     0.0     0.2     0       # as retrieved 2015-07-13 http://www.top500.org/statistics/list
2015.9  98.8    0.0     1.2     0.0     0.0     0       # as retrieved 2015-11-16 http://www.top500.org/statistics/list
2016.5  99.4    0       0.6     0       0       0       # as retrieved 2016-06-20 http://www.top500.org/statistics/list
2016.9  99.6    0       0.4     0       0       0       # as retrieved 2016-11-14 http://www.top500.org/statistics/list
2017.5  99.6    0       0.4     0       0       0       # as retrieved 2017-06-19 http://www.top500.org/statistics/list
2017.9  100     0       0       0       0       0       # as retrieved 2017-11-13 http://www.top500.org/statistics/list
2018.5  100     0       0       0       0       0       # as retrieved 2018-06-25 http://www.top500.org/statistics/list
2018.9  100     0       0       0       0       0       # as retrieved 2018-11-12 http://www.top500.org/statistics/list
2019.5  100     0       0       0       0       0       # as retrieved 2019-06-17 http://www.top500.org/statistics/list
2019.9  100     0       0       0       0       0       # as retrieved 2022-04-21 http://www.top500.org/statistics/list
2020.5  100     0       0       0       0       0       # as retrieved 2022-04-21 http://www.top500.org/statistics/list
2020.9  100     0       0       0       0       0       # as retrieved 2022-04-21 http://www.top500.org/statistics/list
2021.5  100     0       0       0       0       0       # as retrieved 2022-04-21 http://www.top500.org/statistics/list
2021.9  100     0       0       0       0       0       # as retrieved 2022-04-21 http://www.top500.org/statistics/list
Historie souboru
Kliknutím na datum a čas se zobrazí tehdejší verze souboru.
| Datum a čas | Náhled | Rozměry | Uživatel | Komentář | |
|---|---|---|---|---|---|
| současná | 21. 4. 2022, 21:17 | | 1 200 × 720 (47 KB) | Benedikt.Seidl | update 2021 |
| 17. 6. 2019, 22:47 |  | 1 200 × 720 (43 KB) | HeWhoMowedTheLawn | Updated to June 2019 data | |
| 13. 11. 2018, 22:49 |  | 1 200 × 720 (43 KB) | HeWhoMowedTheLawn | updated to Nov 2018 data | |
| 1. 7. 2018, 13:24 |  | 1 200 × 720 (42 KB) | HeWhoMowedTheLawn | add in-diagram labels | |
| 1. 7. 2018, 12:13 |  | 1 200 × 720 (42 KB) | HeWhoMowedTheLawn | updated to June 2018 data | |
| 13. 11. 2017, 20:01 |  | 1 200 × 720 (61 KB) | HeWhoMowedTheLawn | Oops, world domination reached. What's next? | |
| 22. 6. 2017, 10:28 |  | 1 200 × 720 (60 KB) | HeWhoMowedTheLawn | updated to June 2017 data | |
| 15. 11. 2016, 00:31 |  | 1 200 × 720 (60 KB) | HeWhoMowedTheLawn | Updated to Nov 2016 data | |
| 20. 6. 2016, 21:10 |  | 1 200 × 720 (59 KB) | HeWhoMowedTheLawn | updated to June 2016 data | |
| 17. 11. 2015, 20:55 |  | 1 200 × 720 (58 KB) | HeWhoMowedTheLawn | updated to Nov 2015 data |
Využití souboru
Tento soubor používá následující stránka:
Globální využití souboru
Tento soubor využívají následující wiki:
- Využití na az.wikipedia.org
- Využití na de.wikipedia.org
- Využití na de.wikibooks.org
- Využití na en.wikipedia.org
- Využití na et.wikipedia.org
- Využití na eu.wikipedia.org
- Využití na fi.wikipedia.org
- Využití na it.wikipedia.org
- Využití na ja.wikipedia.org
- Využití na ko.wikipedia.org
- Využití na ru.wikipedia.org
- Využití na si.wikipedia.org
- Využití na tr.wikipedia.org
- Využití na uk.wikipedia.org
- Využití na zh.wikipedia.org