
Soubor:Dirac function approximation.gif
Větší rozlišení není k dispozici
Dirac_function_approximation.gif (200 × 335 pixelů, velikost souboru: 89 KB, MIME typ: image/gif, ve smyčce, 10 snímků, 2,0 s)
| Tento soubor pochází z Wikimedia Commons. Níže jsou zobrazeny informace, které obsahuje jeho tamější stránka s popisem souboru. |
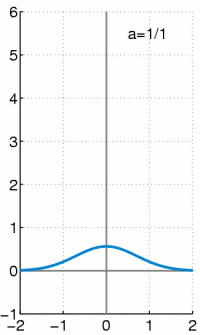
| Popis | Illustration of approximating the Dirac delta function by gaussians. |
| Datum | (UTC) |
| Zdroj | self-made with MATLAB |
| Autor | Oleg Alexandrov |
| Já, autor tohoto díla, jej tímto uvolňuji jako volné dílo, a to celosvětově. V některých zemích to není podle zákona možné; v takovém případě: Poskytuji komukoli právo užívat toto dílo za libovolným účelem, a to bezpodmínečně s výjimkou podmínek vyžadovaných zákonem. |
Source code (MATLAB)
% Illustration of approximating the Dirac delta function with gaussians.

function main()

   r = 3; % the power in the Bernoulli inequality

   % KSmrq's colors
   red    = [0.867 0.06 0.14];
   blue   = [0, 129, 205]/256;
   green  = [0, 200,  70]/256;
   yellow = [254, 194,   0]/256;
   white = 0.99*[1, 1, 1];

  % Set up the grid and other parameters
   N = 300;
   A = -2; B = 2;
   C=-1; D = 6;

   X = linspace(A, B, N);

   % Set up the figure
   lw = 3; % linewidth
   fs = 18; % font size

   for p=1:10

      a=1/p;

      % gaussian
      Y=(1/(a*sqrt(pi)))*exp(-X.^2/a^2);

      figure(1); clf;

      set(gca, 'fontsize', fs);
      set(gca, 'linewidth', 0.4*lw)
      hold on;

      plot_axes (A, B, C, D, lw/1.5);

      plot(X, Y, 'color', blue, 'linewidth', lw);

      axis equal; axis([A, B, C, D]);

      set(gca, 'XTick', [-2, -1, 0, 1, 2]) % text labels on the x axis
      grid on;

      H=text(B-1.5, D-0.5, sprintf('a=1/%d', p), 'fontsize', fs);

      % save to disk
      file = sprintf('Frame%d.eps', 1000+p);
      disp(file);
      saveas(gcf, file, 'psc2')

      pause(0.1);

   end

 % Converted to gif with the command
 % convert -antialias -density 100 -delay 20 -loop 10000 Frame10* Dirac_function_approximation.gif
 % then scaled in Gimp

function plot_axes (A, B, C, D, lw)

   gray = 0.5*[1, 1, 1];

   plot([A B], [0, 0], 'linewidth', lw, 'color', gray);
   plot([0, 0], [C, D], 'linewidth', lw, 'color', gray);
Historie souboru
Kliknutím na datum a čas se zobrazí tehdejší verze souboru.
| Datum a čas | Náhled | Rozměry | Uživatel | Komentář | |
|---|---|---|---|---|---|
| současná | 13. 1. 2008, 00:51 | | 200 × 335 (89 KB) | Oleg Alexandrov | tweak |
| 13. 1. 2008, 00:22 |  | 217 × 363 (99 KB) | Oleg Alexandrov | {{Information |Description=Illustration of approximating the Dirac delta function by gaussians. |Source=self-made with MATLAB |Date=~~~~~ |Author= Oleg Alexandrov |Permission= |other_versions= }} {{ |
Využití souboru
Tento soubor používá následující stránka:
Globální využití souboru
Tento soubor využívají následující wiki:
- Využití na ar.wikipedia.org
- Využití na bg.wikipedia.org
- Využití na bn.wikipedia.org
- Využití na da.wikipedia.org
- Využití na de.wikipedia.org
- Využití na el.wikipedia.org
- Využití na en.wikipedia.org
- Využití na en.wikibooks.org
- Využití na fa.wikipedia.org
- Využití na fi.wikipedia.org
- Využití na fr.wikipedia.org
- Využití na he.wikipedia.org
- Využití na hi.wikipedia.org
- Využití na hu.wikipedia.org
- Využití na id.wikipedia.org
- Využití na it.wikipedia.org
- Využití na ka.wikipedia.org
- Využití na ko.wikipedia.org
- Využití na nl.wikipedia.org
- Využití na no.wikipedia.org
- Využití na pt.wikipedia.org
- Využití na ro.wikipedia.org
- Využití na simple.wikipedia.org
- Využití na si.wikipedia.org
- Využití na sl.wikipedia.org
- Využití na sr.wikipedia.org
- Využití na sv.wikipedia.org
- Využití na uk.wikipedia.org
- Využití na vi.wikipedia.org
- Využití na zh.wikipedia.org