
Soubor:Sauerstoffgehalt-1000mj2.png

Původní soubor (2 000 × 1 409 pixelů, velikost souboru: 74 KB, MIME typ: image/png)
| Tento soubor pochází z Wikimedia Commons. Níže jsou zobrazeny informace, které obsahuje jeho tamější stránka s popisem souboru. |
| Popis |
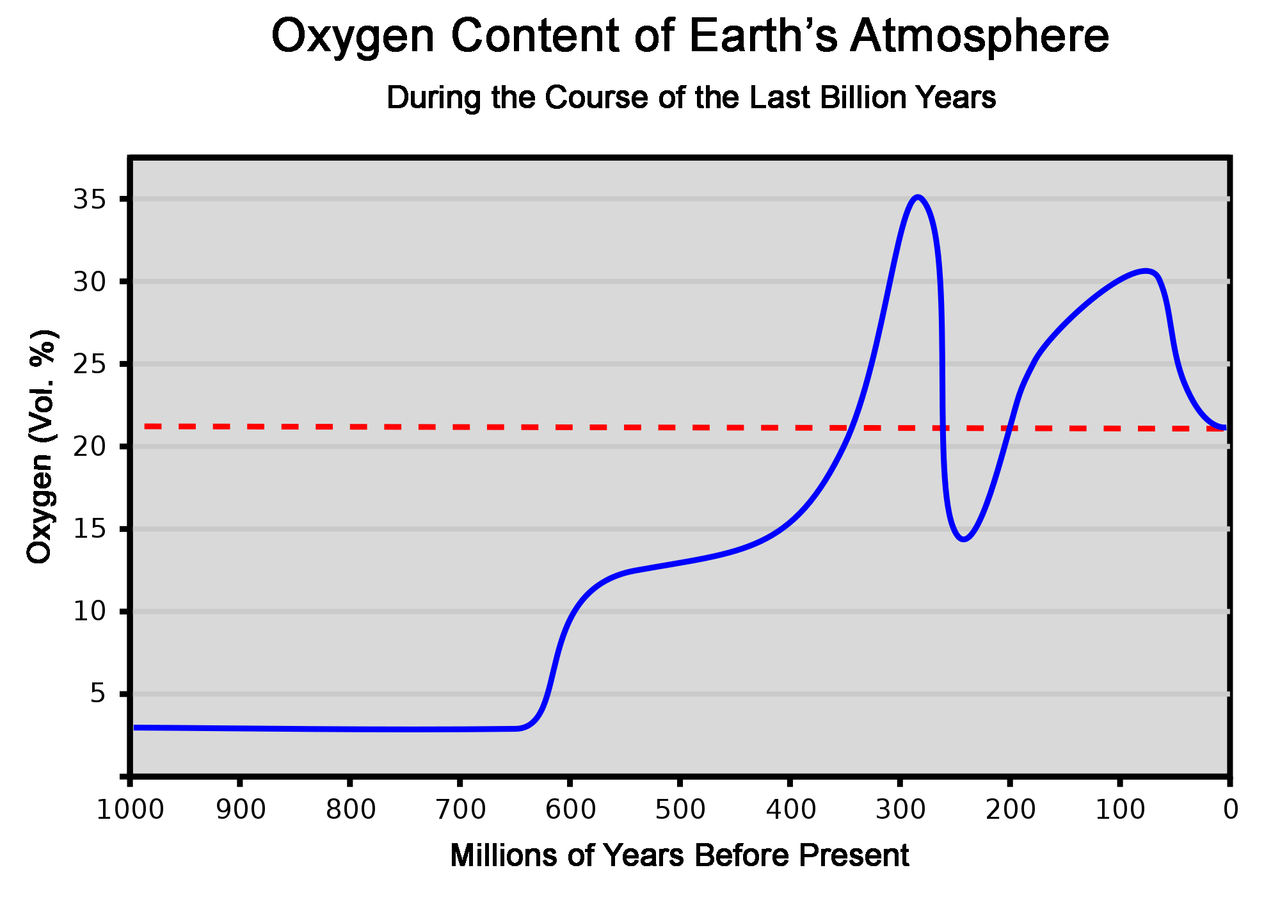
This graph represents the concentration of oxygen in the atmosphere over the last 1000 million years. As a reference, the dashed red line shows the present concentration of 21%. It should be noted that the O2 concentration variation which occurred in past periods can often be estimated only relatively coarsely. Therefore, the chart makes no claim to accuracy, but can only give a broad overview of change at the level of geological periods. This chart is based on the averaged data of several publications. [1][2] Explanation of the curve: After having already begun in the Precambrian, the outgassing of oxygen from the oceans caused atmospheric oxygen to jump from 3% to 12% around the beginning of the Cambrian, because by then all oxygen sinks were finally saturated. Around the same time, the Cambrian explosion took place. During the Silurian and Devonian plants spread over the land, while the animal kingdom was still almost exclusively confined to the water. This caused a further rapid and continuous increase of the oxygen concentration. In the following period carbon burial brought the oxygen level to 35%,[3] thus favoring overgrowth especially in insects. Amphibians and early reptiles were now present on land. Massive volcanic activity at the Permian-Triassic transition caused not only a decline of the oxygen content to 15%, but also the largest mass extinction in geological history. The oxygen concentration then recovered over a long period and reached 26% again by the middle of the Jurassic, and probably even rose to 30% in the Cretaceous. During this time the largest dinosaurs evolved. The end of the Cretaceous period is marked by an impact event, with climate change and a mass extinction. The oxygen level was only 23% 40 million years ago, and had reached the present value of 21% by 25 million years ago. Since then the level has remained constant, apart from fluctuations in the per thousand range. |
| Datum | (UTC) |
| Zdroj | |
| Autor |
|
| Další verze | Díla odvozená od tohoto souboru: OxygenLevel-1000ma.svg |
| Toto je upravený obrázek, což znamená, že byl oproti původní verzi digitálně změněn. Úpravy: Translated text to English. Původní verzi je možné zhlédnout zde: Sauerstoffgehalt-1000mj.svg. Úpravy provedl WolfmanSF.
|
| Já, autor tohoto díla, jej tímto uvolňuji jako volné dílo, a to celosvětově. V některých zemích to není podle zákona možné; v takovém případě: Poskytuji komukoli právo užívat toto dílo za libovolným účelem, a to bezpodmínečně s výjimkou podmínek vyžadovaných zákonem. |
Původní historie souboru
This image is a derivative work of the following images:
- File:Sauerstoffgehalt-1000mj.svg licensed with PD-self
- 2007-10-27T01:17:42Z LordToran 744x524 (41527 Bytes) '
- 2007-07-23T00:08:15Z LordToran 744x524 (42518 Bytes) == Beschreibung == {{Information |Description=Dieses Diagramm stellt die Sauerstoffkonzentration in der Erdatmosphäre im Lauf der letzten Jahrmilliarde dar. Es ist anzumerken, dass die Zeiträume, in denen vergangene Schwan
- 2007-07-17T23:57:50Z LordToran 744x524 (41203 Bytes) {{Information |Description=Dieses Diagramm stellt die Sauerstoffkonzentration in der Erdatmosphäre im Lauf der letzten Jahrmilliarde dar. |Source=Selbst erstellt |Date=2007-07-18 |Author=[http://de.wikipedia.org/wiki/Benutze
Uploaded with derivativeFX
Historie souboru
Kliknutím na datum a čas se zobrazí tehdejší verze souboru.
| Datum a čas | Náhled | Rozměry | Uživatel | Komentář | |
|---|---|---|---|---|---|
| současná | 11. 3. 2010, 12:31 | | 2 000 × 1 409 (74 KB) | WolfmanSF | {{Information |Description=Dieses Diagramm stellt die Sauerstoffkonzentration in der Erdatmosphäre im Lauf der letzten Jahrmilliarde dar. Als Referenz zeigt die gestrichelte rote Linie die heutige Konzentration von 21% an. Es ist anzumerken, dass die Ze |
Využití souboru
Tento soubor nepoužívá žádná stránka.
Globální využití souboru
Tento soubor využívají následující wiki:
- Využití na cdo.wikipedia.org
- Využití na en.wikipedia.org
- Využití na fi.wikipedia.org
- Využití na ha.wikipedia.org
- Využití na hr.wikipedia.org
- Využití na ja.wikipedia.org
- Využití na mk.wikipedia.org
- Využití na no.wikipedia.org
- Využití na pt.wikipedia.org
- Využití na ru.wikipedia.org
- Využití na sh.wikipedia.org
- Využití na simple.wikipedia.org
- Využití na sk.wikipedia.org
- Využití na sr.wikipedia.org
- Využití na sv.wikipedia.org
- Využití na uk.wikipedia.org
- Využití na www.wikidata.org
- Využití na zh.wikipedia.org