
Soubor:Radiocarbon bomb spike.svg

Původní soubor (soubor SVG, nominální rozměr: 600 × 480 pixelů, velikost souboru: 27 KB)
| Tento soubor pochází z Wikimedia Commons. Níže jsou zobrazeny informace, které obsahuje jeho tamější stránka s popisem souboru. |
| Popis |
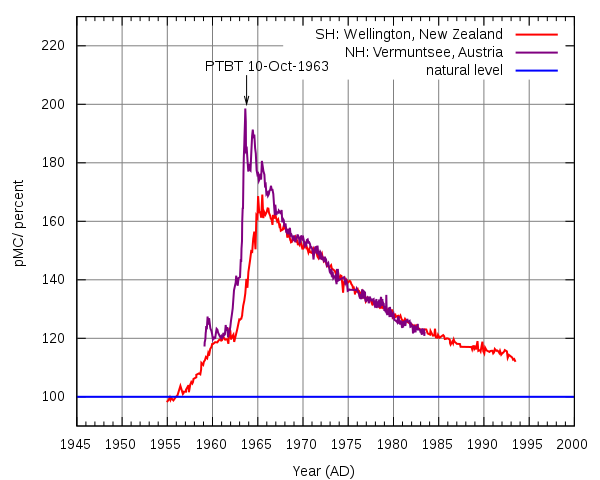
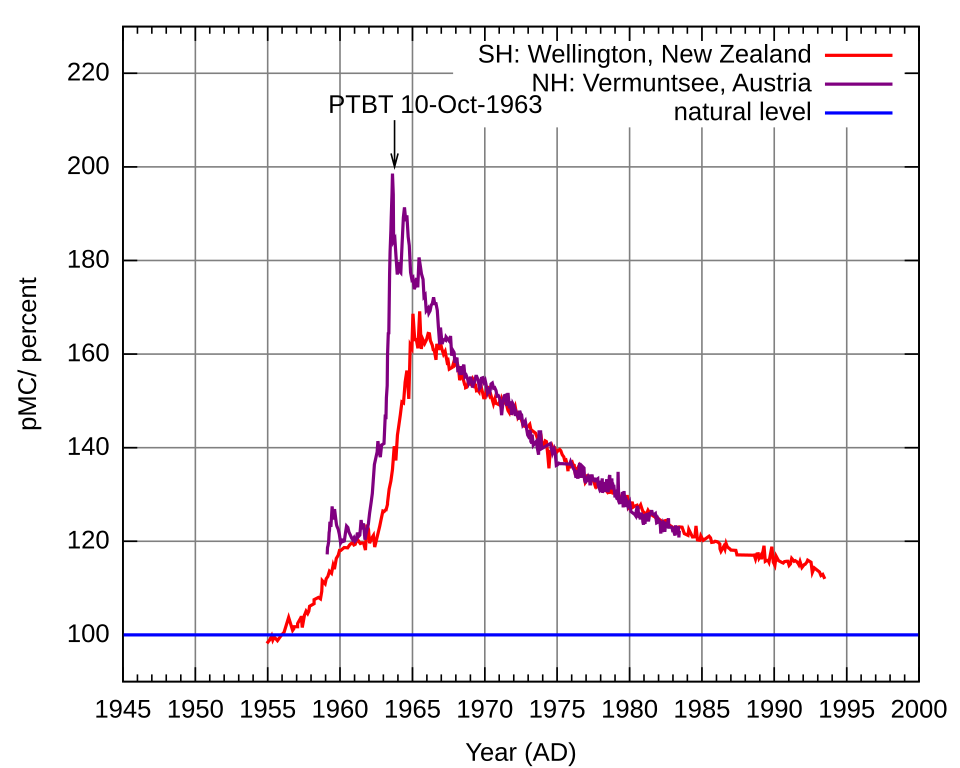
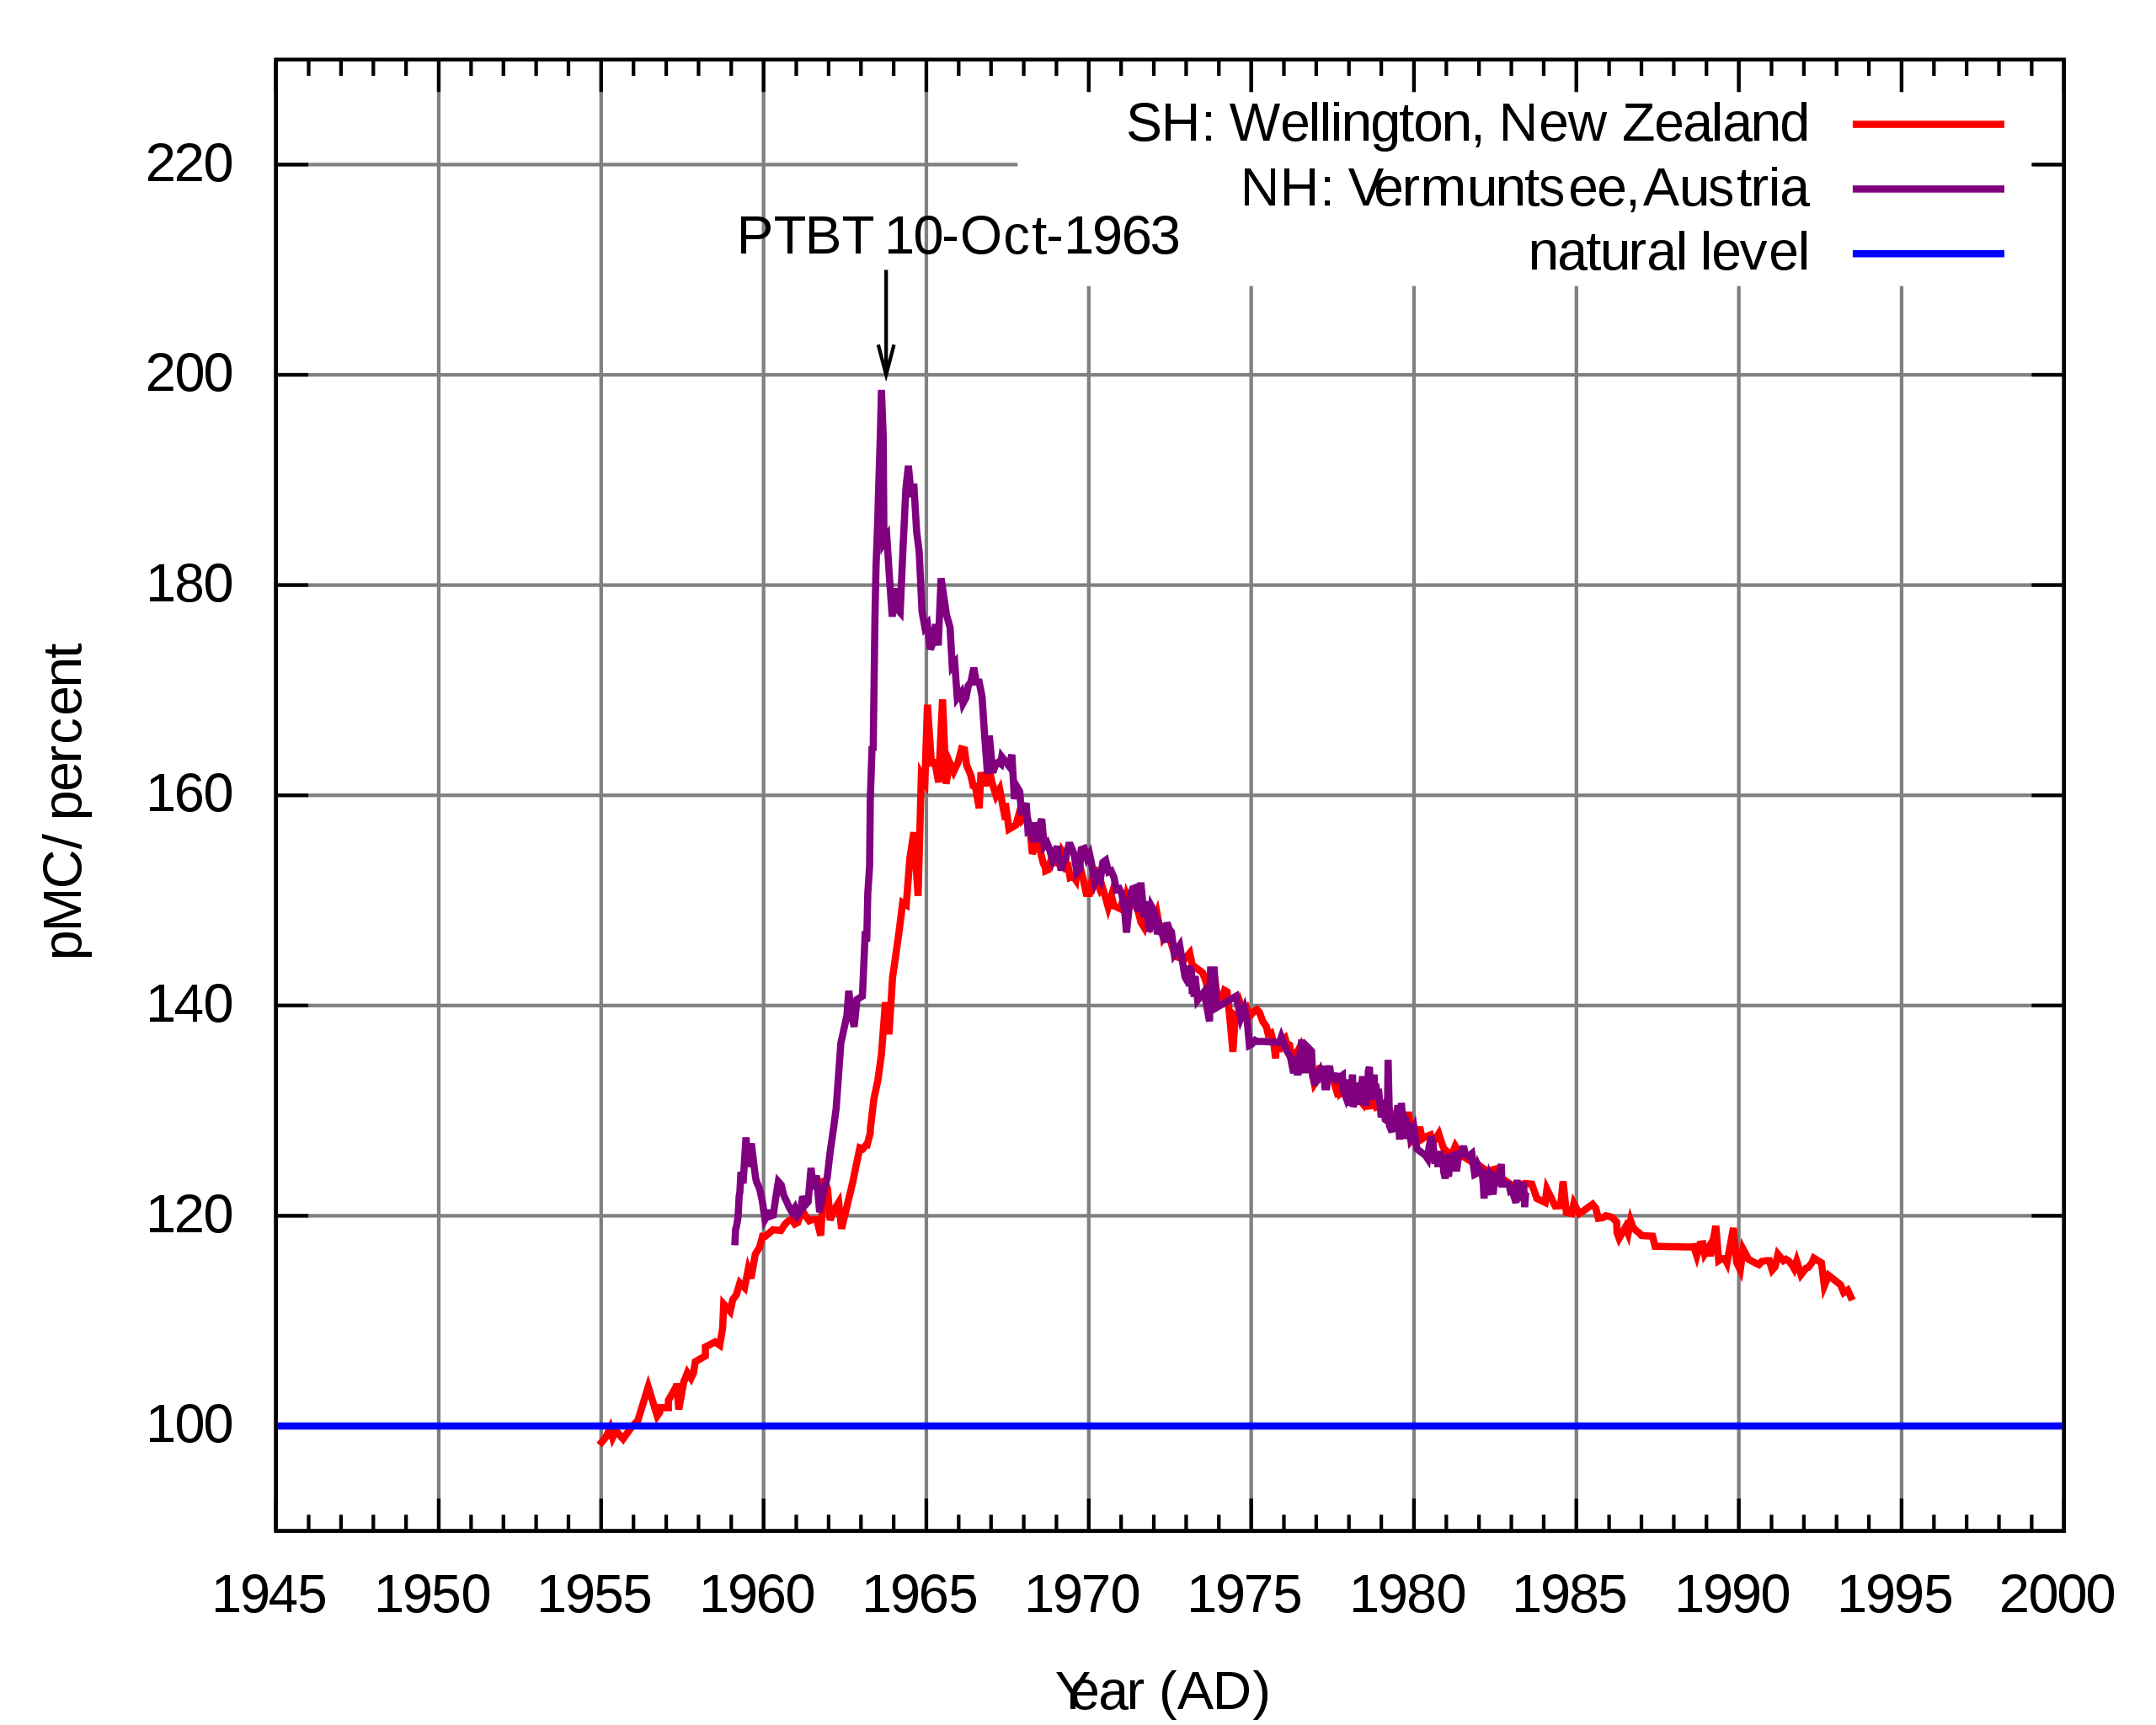
English: Atmospheric 14CO2 in the second half of the 20th century.
The figure shows the 14C / 12C ratio relative to the natural level in the atmospheric CO2 as a function of time in the second half of the 20th century. The plot was generated with gnuplot from data of atmospheric radiocarbon in Wellington, New Zealand 1954AD to 1993AD and at the Vermuntsee, Austria 1959AD to 1983AD. The SVG file from gnuplot has been improved manually. The data sources provide the data as D14C. For the plot the absolute percent modern value has been calculated assuming that each measurement was done in the same year as the respective sample was taken.Deutsch: Atmosphärisches 14CO2 in der zweiten Hälfte des 20. Jahrhunderts. |
||
| Datum | AD 2008-08-09 | ||
| Zdroj |
Vlastní dílo (Původní text: „Own work. Data from the following sources:“)
|
||
| Autor | Hokanomono | ||
| Svolení (Užití tohoto souboru) |
All rights for generating the graphics shall be released. As far as I know there is no copyright protection on measurement data in general.
|
||
| Další verze |
|
||
| SVG vývoj | Tento vektorový obrázek byl vytvořen programem Gnuplot This plot uses embedded text that can be easily translated using a text editor. | ||
| Zdrojový kód | Gnuplot codereset
set term svg enhanced
set output "plot.svg"
set xdata time
set timefmt "%Y-%m-%d"
set xrange ["1945-1-1":"2000-1-1"]
set format x "%Y"
set xtics 5*31556926
set grid
#set title 'Atmospheric ^{14}CO_{2}'
set xlabel 'Year (AD)'
set ylabel 'pMC/ percent'
#see Stuiver Polach for conversion between D14C and pMC
lambda = 1.0 / (8267 * 365.2422 * 24 * 3600)
set arrow from "1963-10-10", 210 to "1963-10-10", 200
set label "PTBT 10-Oct-1963" at "1963-10-10", 210 offset -5,0.5
plot [][90:230] "<awk '!/*/{print \"19\" $1 \"-\" $2 \"-\" $3, mktime(sprintf(\"19%02i %02i %02i 00 00 00\", $1, $2, $3)) - mktime(\"1950 01 01 00 00 00\"), $6, $7;}' welling.195" us 1:(($3+1000)*exp(-lambda*$2)*0.1) tit 'SH: Wellington, New Zealand' w lines, "<awk 'BEGIN{FIELDWIDTHS=\"1 7 5 7 5 2 3 3 4 2 3 3 5 6 5 4 3 2 1\";} /^ HD-/{a = mktime(sprintf(\"19%02i %02i %02i 00 00 00\", $8, $7, $6)); b = mktime(sprintf(\"19%02i %02i %02i 00 00 00\", $12, $11, $10)); present=mktime(\"1950 01 01 00 00 00\"); printf \"%s %g %4g %2g\\n\", strftime(\"%Y-%m-%d\", (a+b)/2), (b-a)/2, b-present, $16, $18;}' vermunt.c14" us 1:(($4+1000)*exp(-lambda*$3)*0.1) tit 'NH: Vermunt, Austria' w lines, 100 tit 'natural level'
set output
|

Historie souboru
Kliknutím na datum a čas se zobrazí tehdejší verze souboru.
| Datum a čas | Náhled | Rozměry | Uživatel | Komentář | |
|---|---|---|---|---|---|
| současná | 10. 4. 2015, 16:32 | | 600 × 480 (27 KB) | Hokanomono | Increase line width. |
| 9. 4. 2015, 10:43 |  | 600 × 480 (27 KB) | Hokanomono | Change green line to purple. | |
| 5. 4. 2011, 22:09 |  | 600 × 480 (27 KB) | Hokanomono | Changed “Vermunt” to “Vermuntsee”. | |
| 9. 8. 2008, 15:30 |  | 600 × 480 (27 KB) | Hokanomono | {{Information |Description= |Source= |Date= |Author= |Permission= |other_versions= }} | |
| 15. 3. 2006, 00:27 |  | 600 × 480 (21 KB) | Hokanomono | This is a new version of Media:Atmospheric radiocarbon 1954-1993.svg. I have changed the title because I'm using additional data sources now. |
Využití souboru
Tento soubor používají následující 2 stránky:
Globální využití souboru
Tento soubor využívají následující wiki:
- Využití na be.wikipedia.org
- Využití na bg.wikipedia.org
- Využití na ca.wikipedia.org
- Využití na cv.wikipedia.org
- Využití na da.wikipedia.org
- Využití na de.wikipedia.org
- Radiokarbonmethode
- Kernwaffen-Effekt
- Vertrag über das Verbot von Kernwaffenversuchen in der Atmosphäre, im Weltraum und unter Wasser
- Portal:Chemie/Übersicht Lesenswerte Artikel
- Portal:Chemie/Artikelauszug/Radiokohlenstoffdatierung
- Diskussion:Radiokarbonmethode/Archiv/1
- Salted Bomb
- Portal:Physik/Artikel des Monats 2018-09
- Wikipedia Diskussion:Hauptseite/Artikel des Tages/Archiv/Vorschläge/2021/Q4
- Wikipedia:Hauptseite/Archiv/26. Dezember 2021
- Využití na en.wikipedia.org
- Background radiation
- Partial Nuclear Test Ban Treaty
- Nuclear fallout
- Carbon-14
- Radioactive contamination
- User talk:Hokanomono
- Wikipedia:Reference desk/Archives/Science/2009 January 3
- User:Boundarylayer/sandbox
- Bomb pulse
- Wikipedia:WikiProject Wikipack Africa Content/Wikipedia:Showcase
- Wikipedia:WikiProject WikiFundi Content/Radiocarbon dating
- Wikipedia:WikiProject WikiFundi Content/Wikipedia:Showcase
- Využití na eo.wikipedia.org
- Využití na es.wikipedia.org
- Využití na et.wikipedia.org
- Využití na fr.wikipedia.org
- Využití na he.wikipedia.org
- Využití na hi.wikipedia.org
- Využití na hr.wikipedia.org
- Využití na hu.wikipedia.org
- Využití na hy.wikipedia.org
- Využití na it.wikipedia.org
- Využití na ja.wikipedia.org
- Využití na ka.wikipedia.org
Zobrazit další globální využití tohoto souboru.