
Soubor:Energy change inventory, 1971-2010cs.svg

Velikost tohoto PNG náhledu tohoto SVG souboru: 525 × 365 pixelů. Jiná rozlišení: 320 × 222 pixelů | 640 × 445 pixelů | 1 024 × 712 pixelů | 1 280 × 890 pixelů | 2 560 × 1 780 pixelů.
Původní soubor (soubor SVG, nominální rozměr: 525 × 365 pixelů, velikost souboru: 3 KB)
| Tento soubor pochází z Wikimedia Commons. Níže jsou zobrazeny informace, které obsahuje jeho tamější stránka s popisem souboru. |
Popis
| Popis |
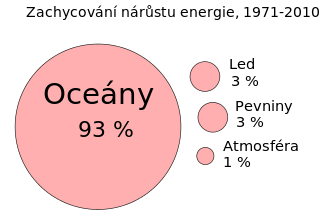
English: This bubble graph shows how the extra energy trapped by anthropogenic (i.e., human) greenhouse gases has been distributed on the Earth. This is referred to as "radiative imbalance", where less energy leaves Earth's atmosphere than enters it. Earth has been in radiative imbalance since at least the 1970s. Most of this extra energy has been absorbed by the oceans.
Data The following data shows how the extra energy trapped by anthropogenic greenhouse gases has been distributed on the Earth between 1971 and 2010: Oceans: 93% Ice: 3% Continents: 3% Atmosphere: 1% Further information can be found in the source listed in the references section. References Rhein, M., et al. (7 June 2013), "Box 3.1, in: Chapter 3: Observations: Ocean (final draft)", in Qin, D. and T. Stocker, Climate Change 2013: The Physical Science Basis. Working Group I Contribution to the Intergovernmental Panel on Climate Change (IPCC) 5th Assessment Report, IPCC, http://www.climatechange2013.org/images/uploads/WGIAR5_WGI-12Doc2b_FinalDraft_Chapter03.pdf, pp.11-12 (pp.14-15 of PDF chapter).Čeština: Tento bublinový graf ukazuje, jak je přidaná energie dík "pasti" antropogenních (tj. lidských) skleníkových plynů distribuována na Zemi. Označuje se to jako "radiační nerovnováha", kdy méně energie opouští zemskou atmosféru, než do ní vstupuje. Země je v radiačním nerovnováze přinejmenším od 70tých let 20. století. Většina z této přidané energie byla pohlceny oceány.
Údaje (data) Následující údaje ukazují, je přidaná energie dík "pasti" antropogenních (tj. lidských) skleníkových plynů distribuována na Zemi v letech 1971 až 2010: oceány: 93 % led: 3 % kontinenty: 3 % atmosféra: 1 %Další informace viz reference v anglickém popisu. |
| Datum | |
| Zdroj | Wikimedia Commons, own translation from File:Energy_change_inventory,_1971-2010.svg |
| Autor | User:Enescot |
| Další verze | File:Energy_change_inventory,_1971-2010.svg (English) |
Licence
| Tento soubor byl uvolněn pomocí Creative Commons CC0 1.0 Universal Public Domain Dedication. | |
| Osoba, která toto dílo označila tímto dokumentem, dílo uvolnila do public domain tím, že se celosvětově vzdala všech autorských práv ke svému dílu včetně všech souvisejících a příbuzných zákonných práv, které k dílu má, v rozsahu umožněném zákonem. Můžete toto dílo rozmnožovat, upravovat, rozšiřovat či provozovat, i pro komerční účely, vše bez nutnosti žádat o svolení.
|
Historie souboru
Kliknutím na datum a čas se zobrazí tehdejší verze souboru.
| Datum a čas | Náhled | Rozměry | Uživatel | Komentář | |
|---|---|---|---|---|---|
| současná | 7. 2. 2014, 16:20 | | 525 × 365 (3 KB) | Jirka Dl | Missing numbers addes |
| 7. 2. 2014, 16:17 |  | 525 × 365 (11 KB) | Jirka Dl | User created page with UploadWizard |
Využití souboru
Tento soubor používá následující stránka: